
Currency hedged, tax exposed: is history about to repeat?

Tom Wickenden
13 minutes reading time
Related articles

This information is for the use of licensed financial advisers and other wholesale clients only.
Quarterly commentary from the Betashares investment strategy team. Providing an overview on global equity market performance, company earnings, valuations and fundamentals, asset class correlations, and asset flows.
Key Takeaways
- Global equity markets continued to rally higher in Q2, driven by strong earnings growth from the US’ Magnificent 7 and optimism around AI. Japan, Europe and India also posted strong equity index level gains for H1.
- Risks to global equities for H2 include market concentration and valuations, now at historic levels for the S&P 500, and rising political uncertainty. With over 50% of the world’s population voting in major elections this year we can expect heightened equity volatility and a focus on election outcomes.
- Australia’s financial sector, led by the Big 4 banks, returned over 16% for H1. This strong contribution from the largest sector ensured the ASX200 index is up year to date. With muted earnings growth expected for Australia’s large caps, there is arguably a case for looking beyond broad market index exposures for better growth and/or valuations.
Performance – Global Equities
- The second quarter of 2024 was a mixed bag in terms of equity market performance globally. Region-specific factors caused higher volatility and Nvidia showed its sway.
- In 2024 over 80 countries and more than 50% of the world’s population will vote in major elections. Q2 saw the first impacts on major equity markets of these risk events:
- A surprise landslide victory to the ruling party in Mexico drove the local equity market lower, down ~10%, on fears that the government will pursue popularist policies that add to budget deficits and may threaten the central bank’s independence.
- Indian Prime Minister Narendra Modi lost his parliamentary majority for the first time since he took power in 2014. Initial fears of a locked parliament, leading to a single day 6% drop in the Indian share market, subsided as Modi shored up ally parties to create a coalition government – with markets recouping all the losses and some. The long-term view on India remains positive with no major changes to the country’s promising growth trends and pro-business policy settings.
- Macron called a snap French election after a surge in support for the far-right French National Rally (NR) party during the EU elections. After the second round of voting (on 7 July, at the time of writing), France faces a hung parliament with the left-wing New Popular Front (NFP) alliance winning the most seats. While not seen as the “worst case” outcome, any result that leaves a hung parliament will likely increase political instability going forward. The initial reaction on Futures markets was muted however, with only a marginal expansion in the spread between French and German government bonds.
- The Labour landslide in the UK was broadly expected by the polls and market participants.
- In November we have the US presidential election. We note that the 27 June first presidential debate between Trump and Biden received a lot of media attention, but very little reaction from US equity markets.
- Elsewhere over the quarter,
- Hong Kong’s Hang Seng Index (HSI) jumped 21% from April to mid-May on the back the Chinese government’s promise to introduce five measures to improve Hong Kong’s exchange and financial strength. However, the market resumed its downward trajectory, pairing 9% into the quarter end. This was the third dead cat bounce in a -40% bear market for the HSI, that started in early 2021.
- Nvidia touched the USD3tn market cap milestone momentarily becoming the largest company in the world. However, a historic selloff near the end of the quarter, shedding USD646bn, has shown the impact it can have on global equity markets. The correction contributed -0.66% to the MSCI World’s returns over just 3-days.
Betashares Global Equity Markets Monitor
28 June 2024
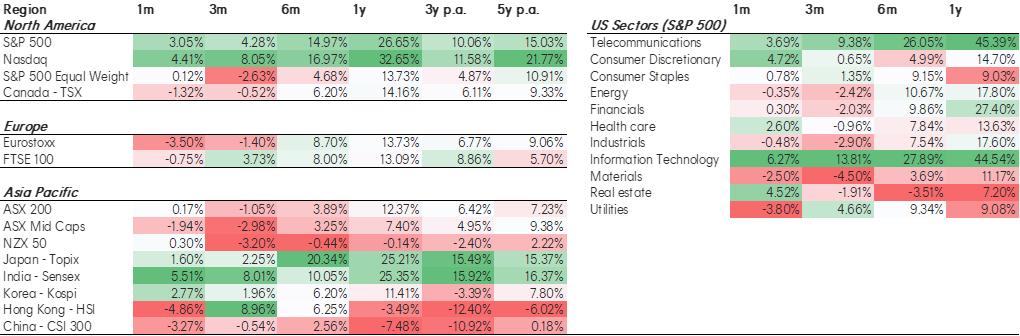
Source: Bloomberg, Betashares. As at 28 June 2024. Denotes index performance. You cannot invest directly in an index. Past performance is not an indicator of future performance.
Performance – Australian Equities
- The Australian market traded in a choppy sideways range over Q2 with strong performance from financials more than offset by the material sector’s losses as iron ore prices near 12-month lows.
- The Australian finance sector has now accounted for over 100% of the ASX 200’s returns year to date. Over the 12-month period the sector has even outpaced the US’s S&P 500. The incredible run has been led by the ‘Big 4’ banks contributing ~80% to the ASX’s returns YTD.
- A concern going forward will be whether the Australia’s financial sector can continue its run. The S&P 500 has enjoyed an expected 10.7% earnings growth over FY24 and is projected to grow by 15% in FY25. By comparison, the Australian financial sector’s earnings are expected to fall by -3.9% in FY24, and only grow by 2.7% in FY25.
- The ‘Big 4’ now account for over 20% of the ASX 200 index weight. Much like concerns about US equity market concentration, now could be the time for looking outside of the top 20 stocks in the Australian equity market. Australia’s midcaps have underperformed the ASX200’s 12-month rally by 5% and as a result are now trading at a 27% Fwd P/B discount compared to the broader market.
- Looking forward, Australia’s midcaps are forecasted to grow earnings at over 10% in the next 12-month, more than double the ASX200’s expectations.
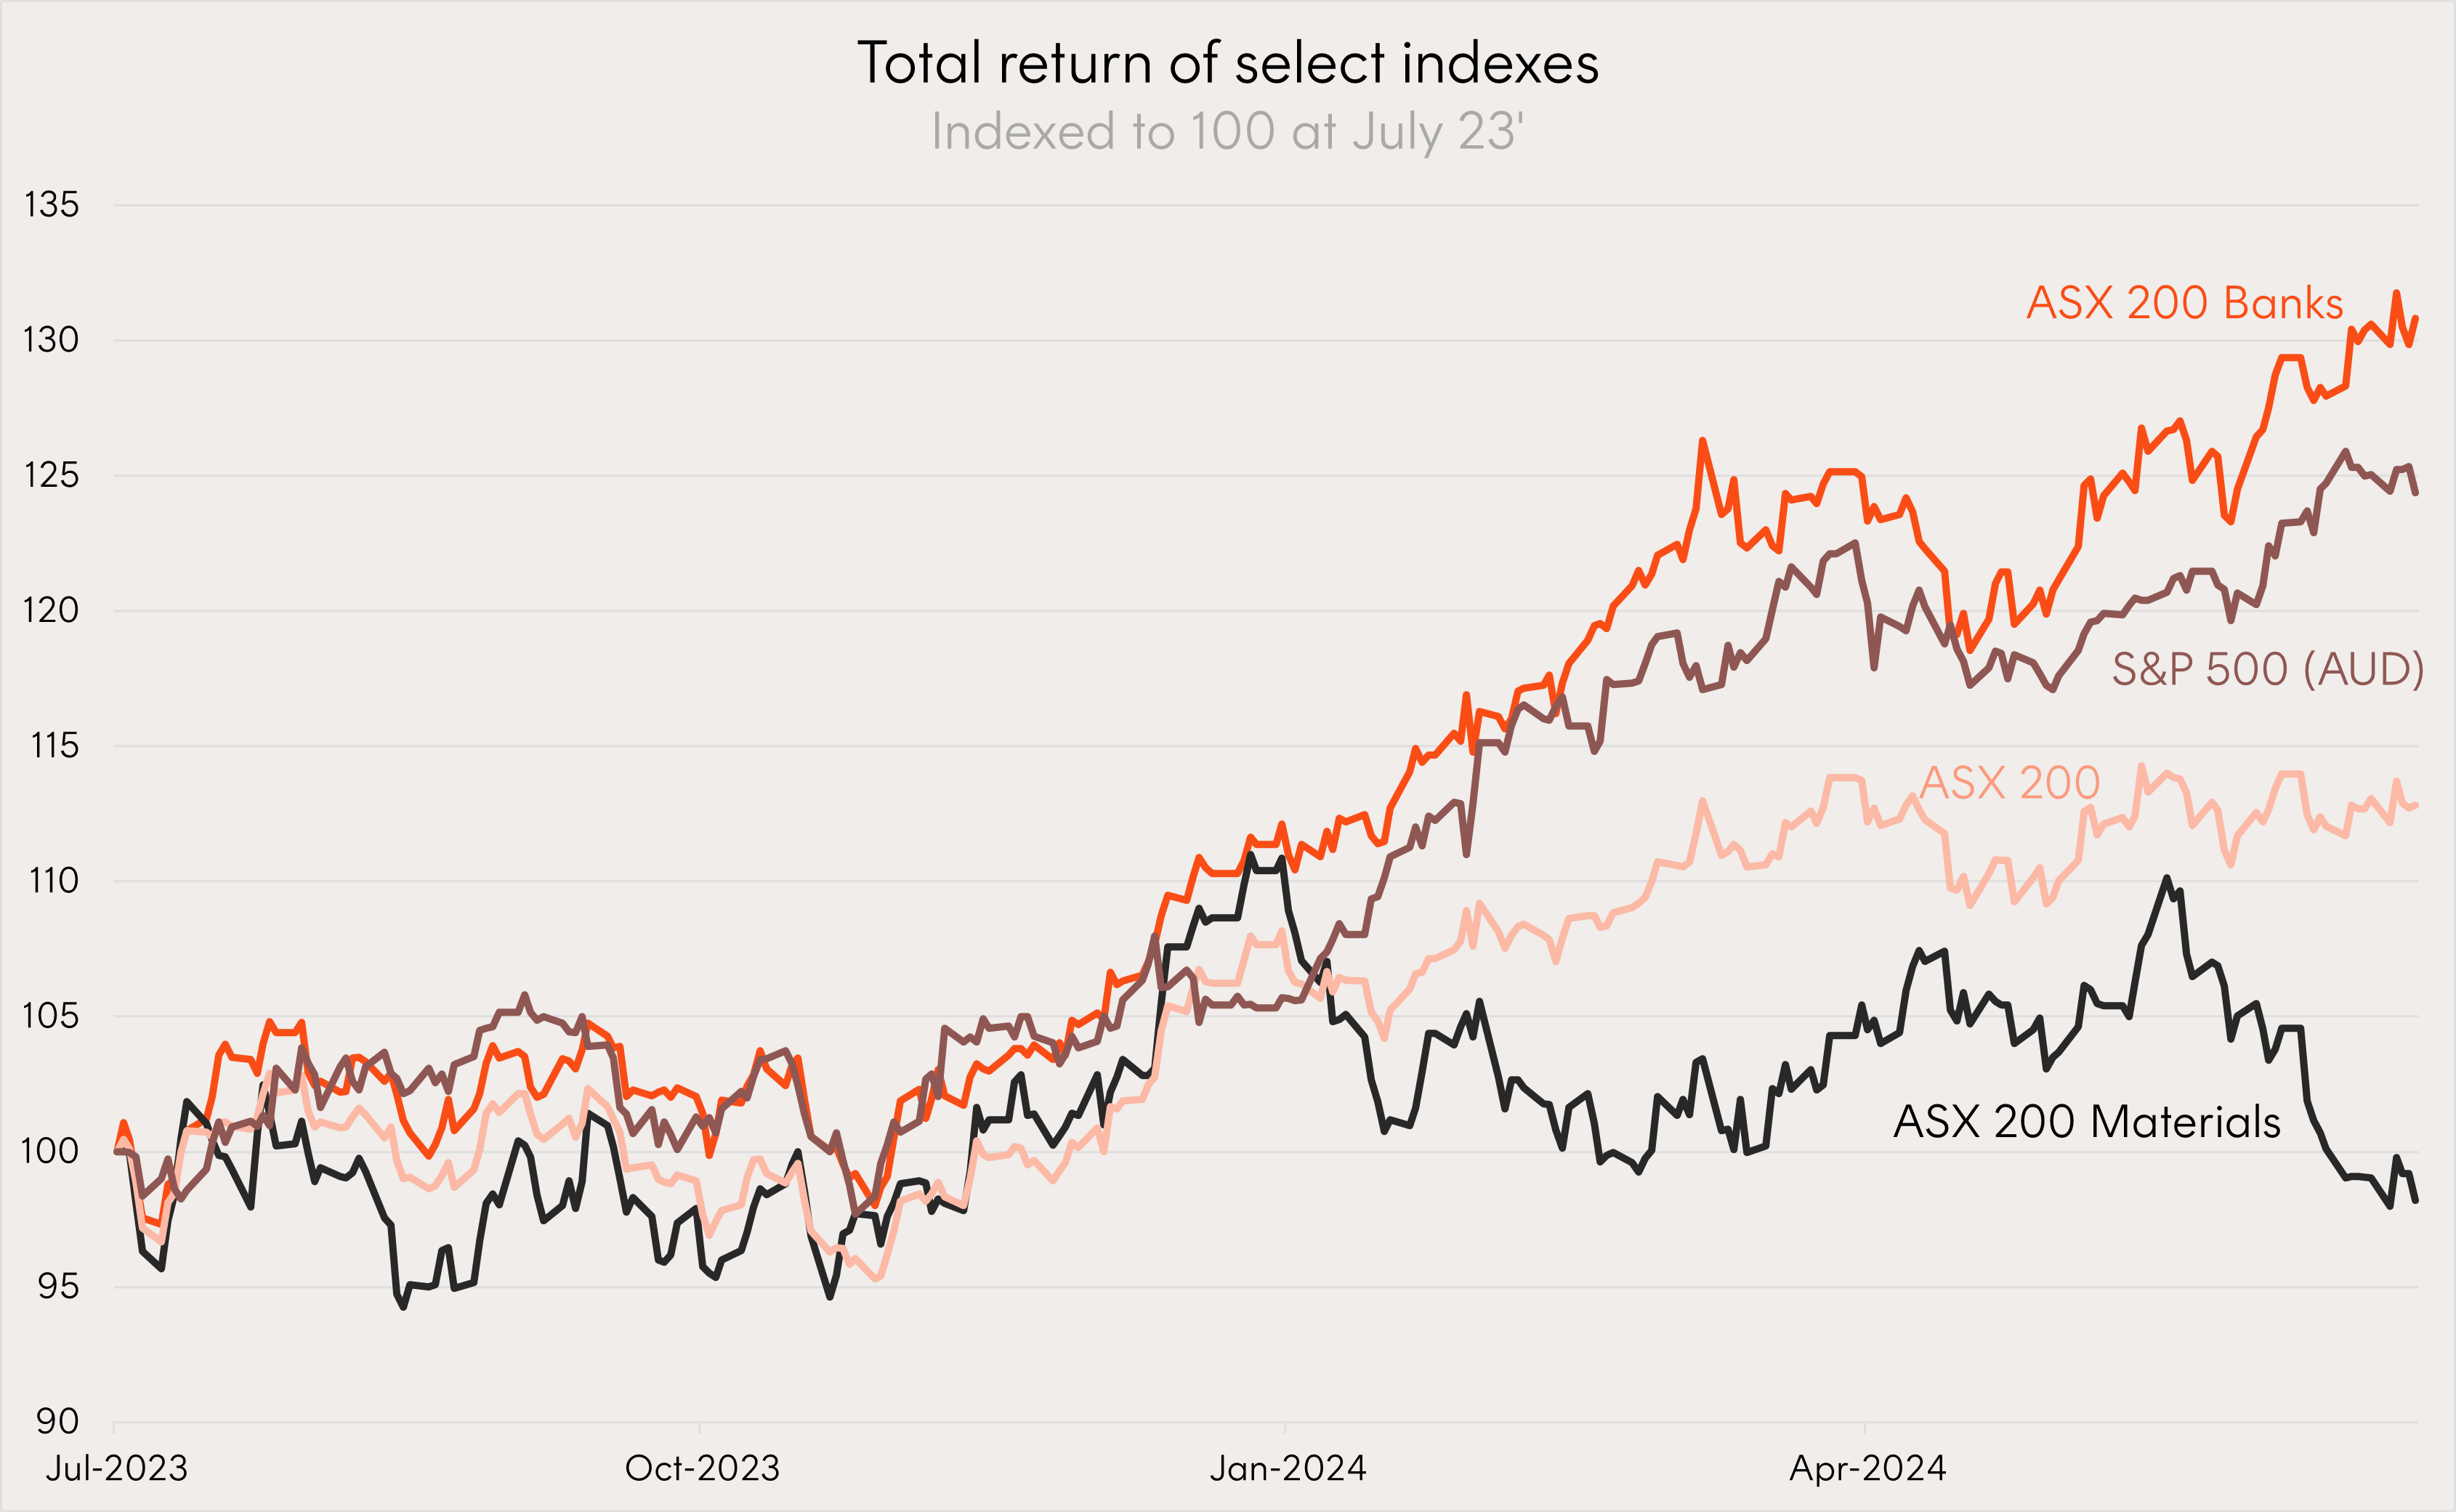
Source: Bloomberg, Betashares. As at 28 June 2024. You cannot invest directly in an index. Past performance is not an indicator of future performance.
 Source: Bloomberg, Betashares. As at 28 June 2024. You cannot invest directly in an index. Past performance is not an indicator of future performance.
Betashares Global Equity Markets Monitor – 28 June 2024

Source: Bloomberg, Betashares. As at 28 June 2024. MSCI World Factor Indices used to represent factor returns. Denotes index performance. You cannot invest directly in an index. Past performance is not an indicator of future performance.
Corporate Earnings – US Q1 24’
- Another supportive quarterly earnings season in the US was headlined by the largest technology companies, whilst some consumer discretionary stocks reported their customers were starting to feel the pinch.
- The ‘Magnificent 7’ kept justifying recent price performance after reporting on aggregate a 53% increase in earnings growth over the year to March 2024. As a whole the S&P 500 experienced 8% earnings growth, however without these 7 names (notwithstanding Tesla’s negative results) the index would have reported flat.
- Nvidia was again on top reporting 461% growth in earnings whilst Tesla’s earnings fell by -47% year-on-year. Despite the continued earnings slump, Tesla’s share price recorded its first positive quarterly return in a year after bringing forward the launch of new models and touting grander ambitions for AI.
- Insight into the American consumer came anecdotally through consumer discretionary companies like McDonalds and Six Flags (national theme park operator) indicating that customers are becoming more wary in spending every incremental dollar.
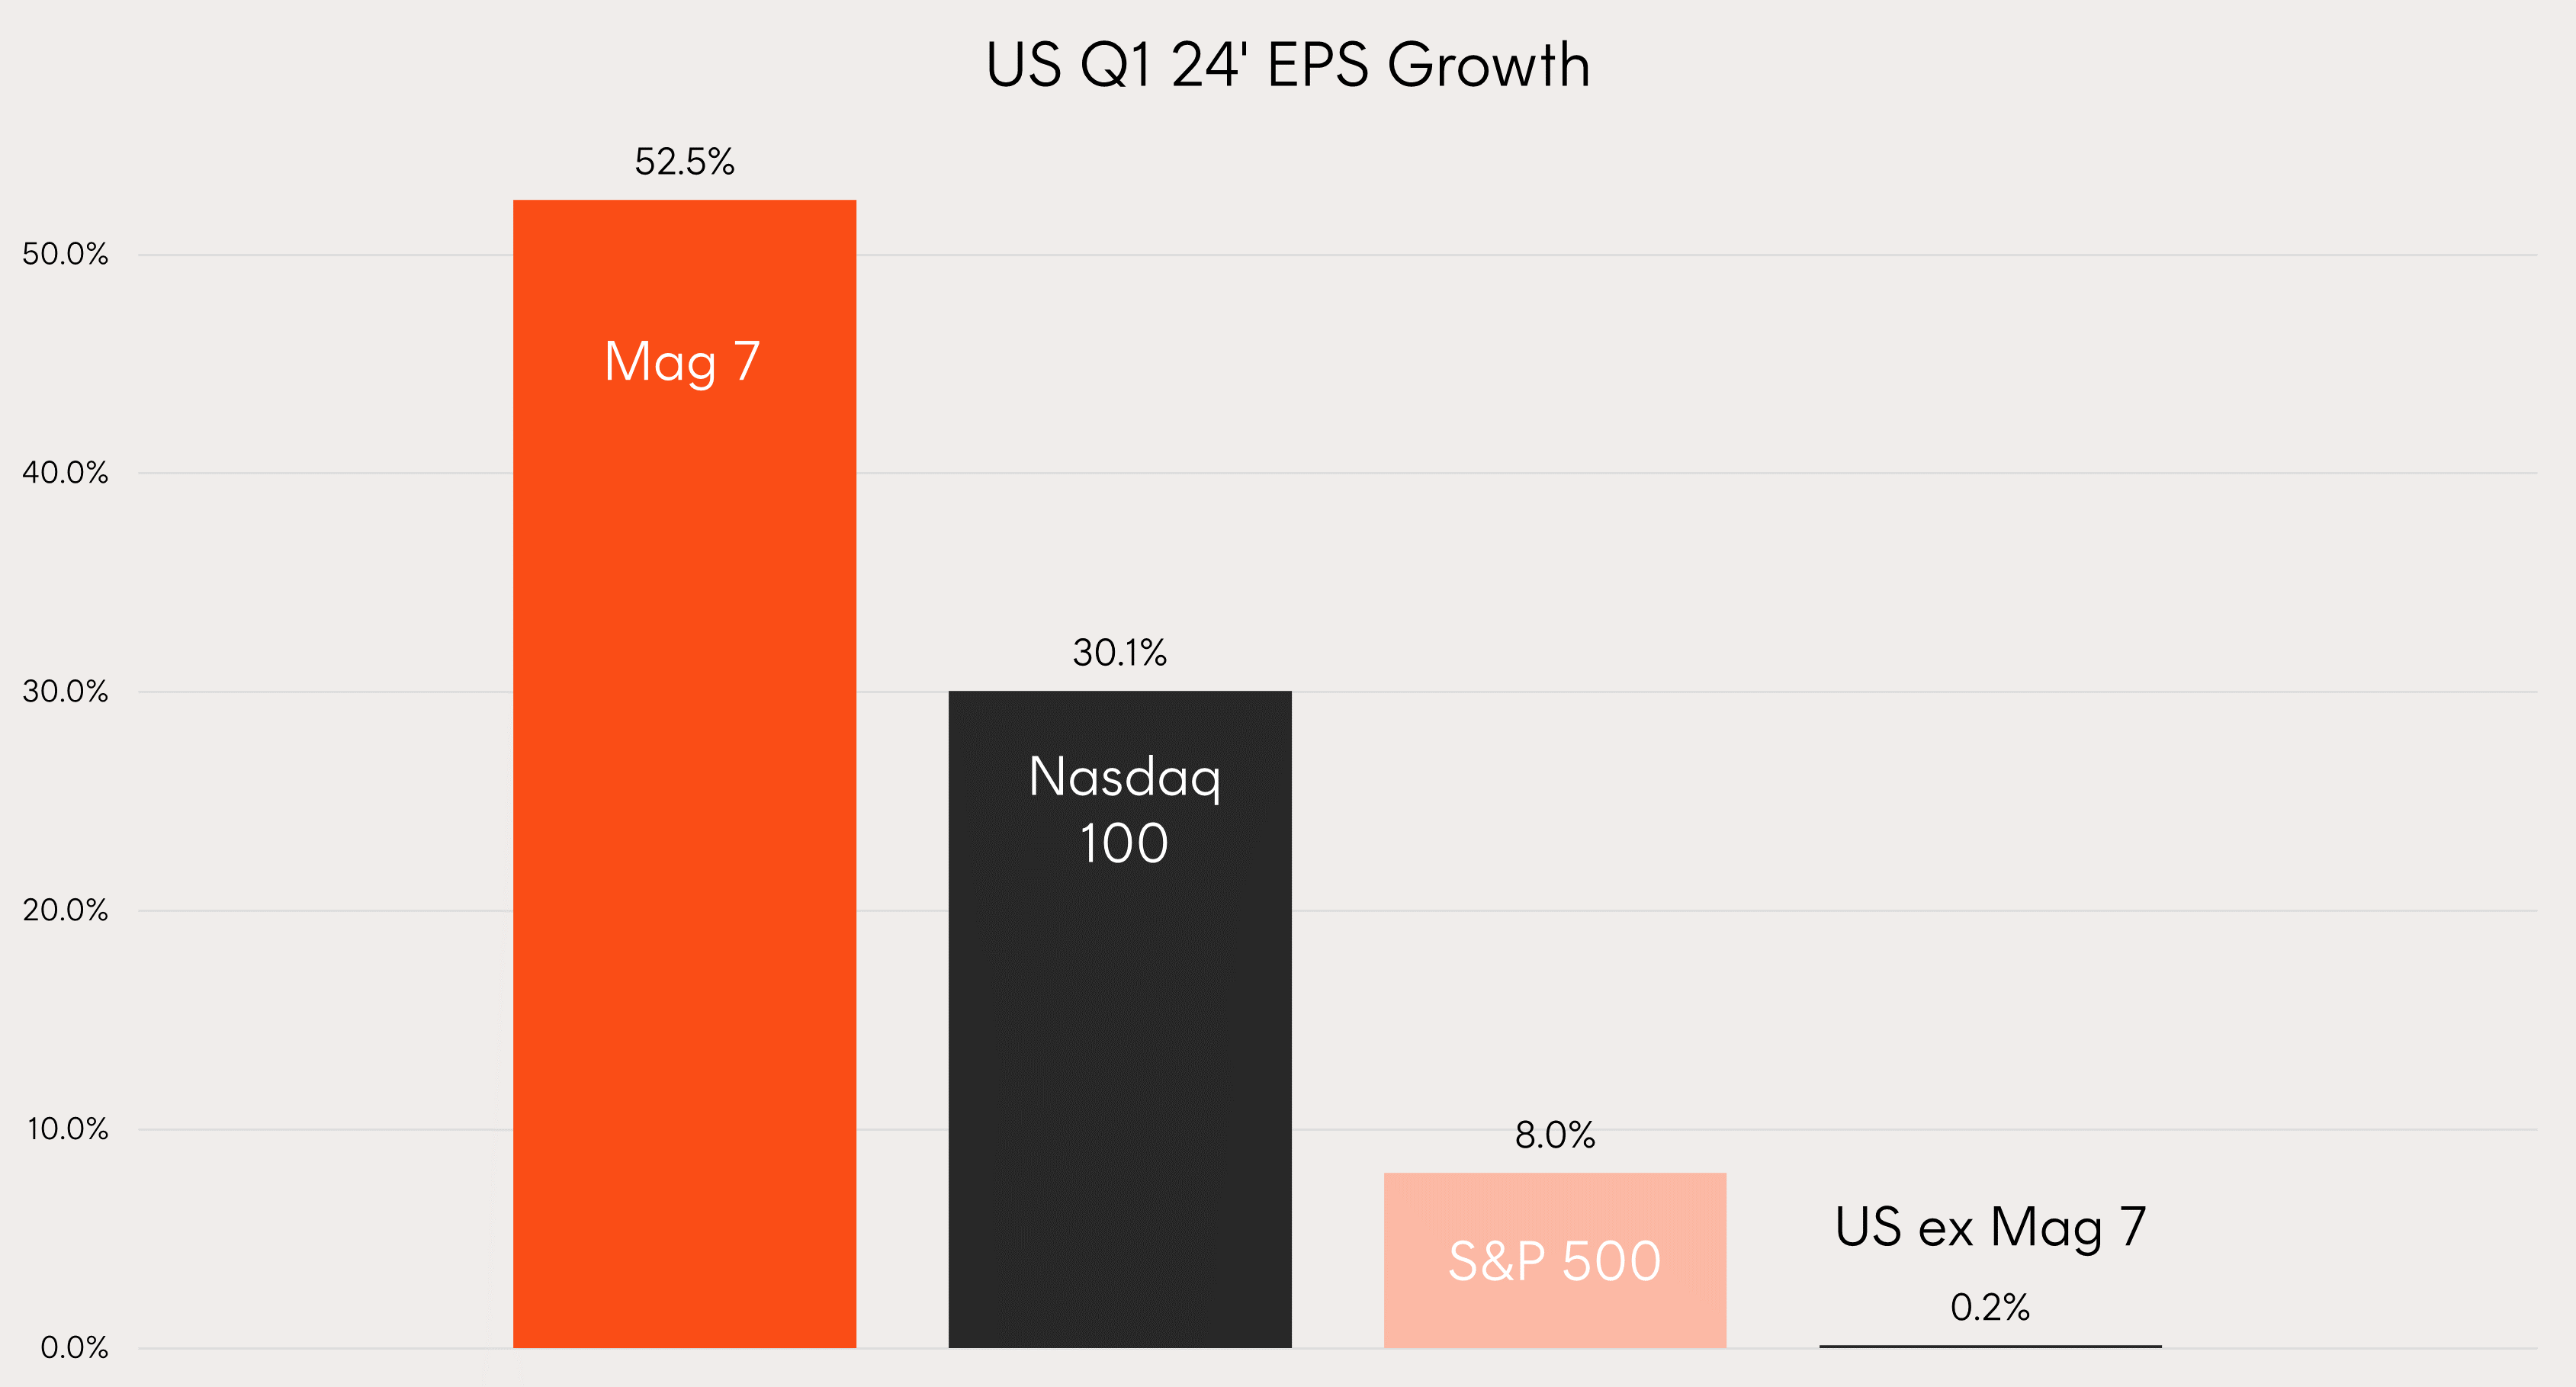
Source: Bloomberg, Betashares. Q1 24’ earnings of US companies and indexes. Mag 7 is the Bloomberg Magnificent 7 Index. US ex Mag 7 is the Bloomberg Us Large Cap ex Magnificent 7 Index. Past performance is not an indicator of future performance.

Source: Bloomberg, Betashares. Q1 24’ earnings growth surprises of S&P 500 sectors. Past performance is not an indicator of future performance.
Corporate Earnings – Australia H1 24’
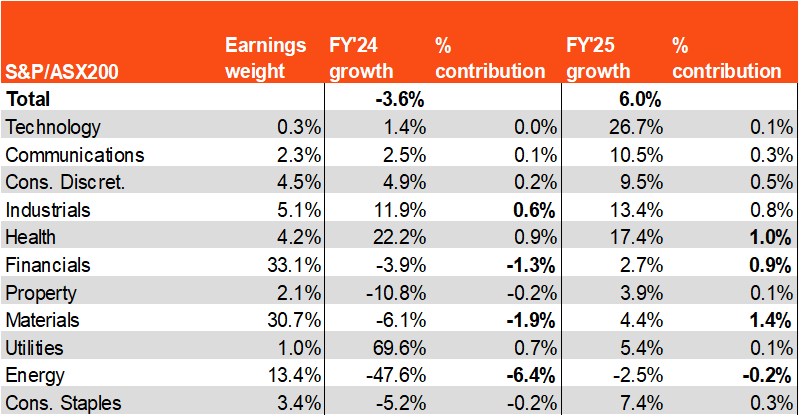
- Heading into the August reporting season the market will be hoping for positive earnings surprises to justify the valuation led rally in the ASX this year. The ASX200 has risen 12.5% over the past 12 months while earnings are estimated to have fallen by 3.6% – with the indexes forward P/E expanding from 15x to 17.4x over the same period.
- All eyes will be on the financial sector. Current expectations have earnings falling by 3.9% yoy however these expectations have been improving heading into reporting. If we continue to see positive earnings revisions or even earnings ‘beats” for financials, investors may continue to find reasons to justify recent performance.
- Outside of financials the cyclical nature of Australia’s large materials and energy sectors will be the biggest drag on YoY earnings with technology, industrials, healthcare and utilities leading the gains.
- There are also hopes of positive forward guidance on the back of tax cuts and expected rate cuts. However, recent inflation prints, and the RBA’s resolute stance will likely lead to cautious outlooks. Markets will sift for anecdotal evidence of how consumer strength and confidence are holding up under the higher for longer environment – both of which appeared better than expected in H2 23’ reporting.
ASX200 Forward Earnings Expectations
Source: FactSet, Betashares. As at 28 June 2024. S&P/ASX 200 sector forward earnings estimates.
Valuations and fundamentals
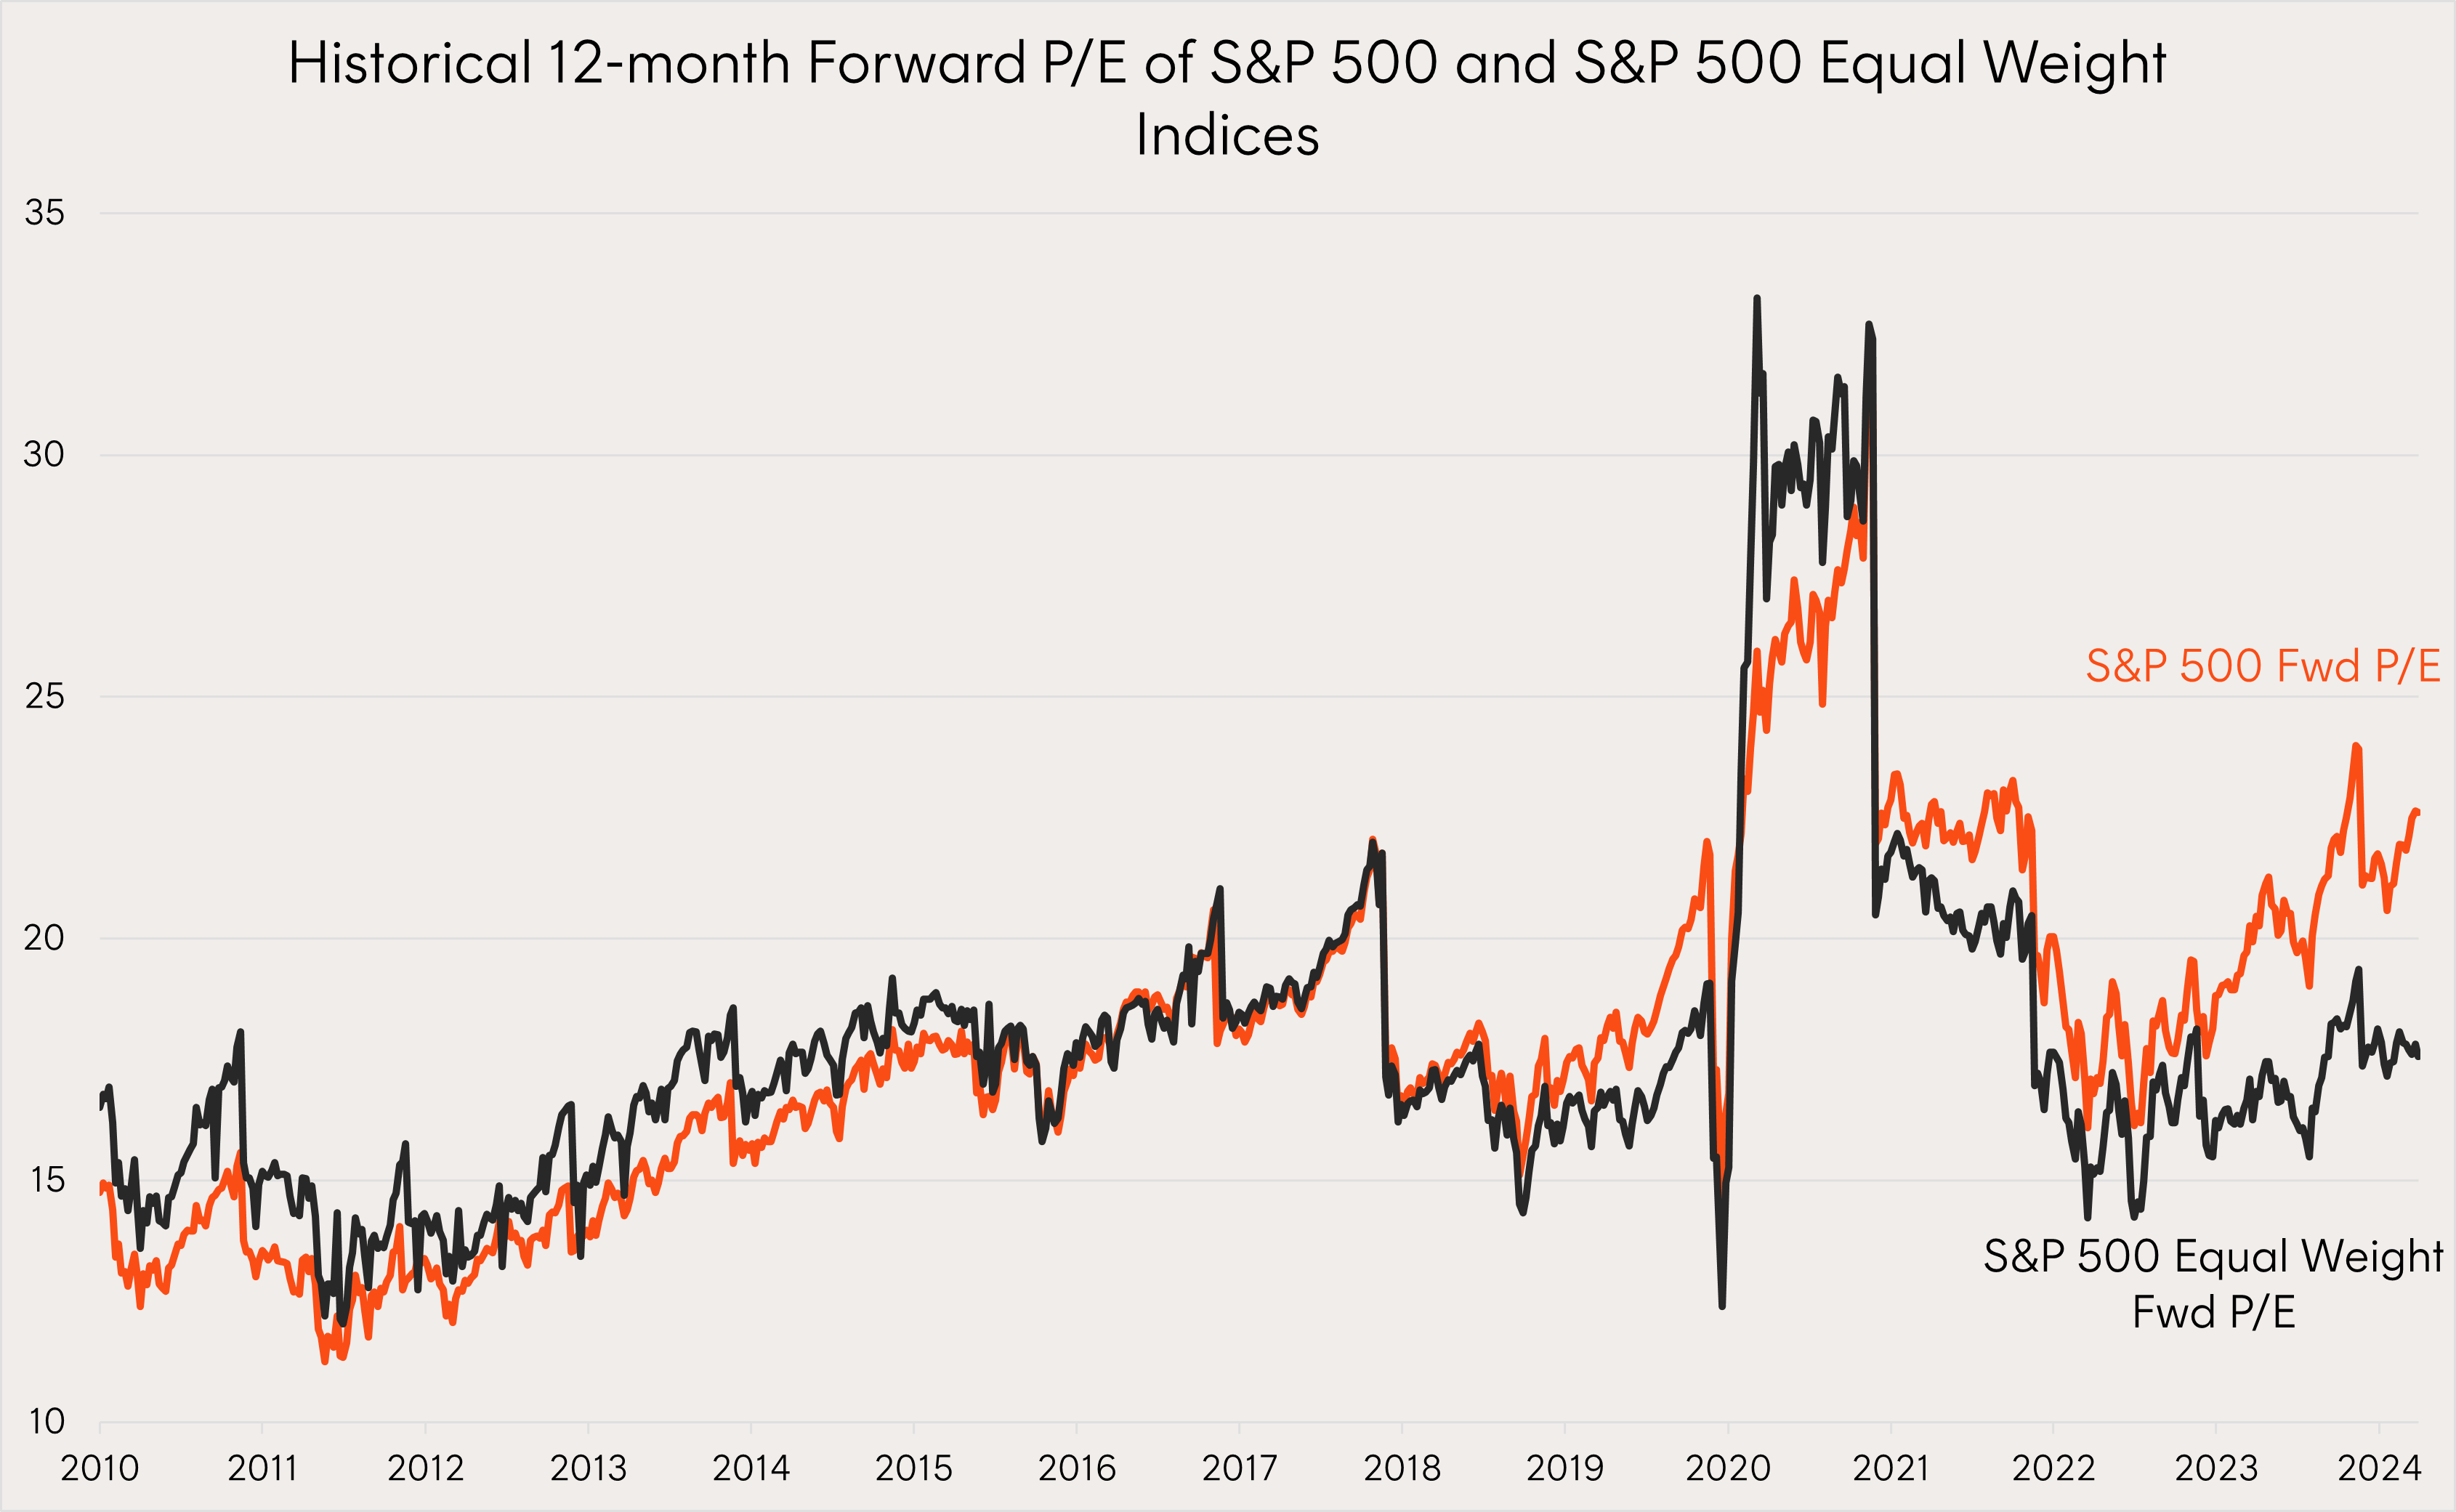
- US index valuations crept up over the quarter on the back of big tech performance. On a relative basis the S&P 500 Equal Weight Index (SPEW) has completely disconnected from the valuation of its parent S&P 500 Market Cap Index (SPX) with the equal weight index, which usually trades on par with the market cap index, now trading at a historically large forward P/E discount of 22%.
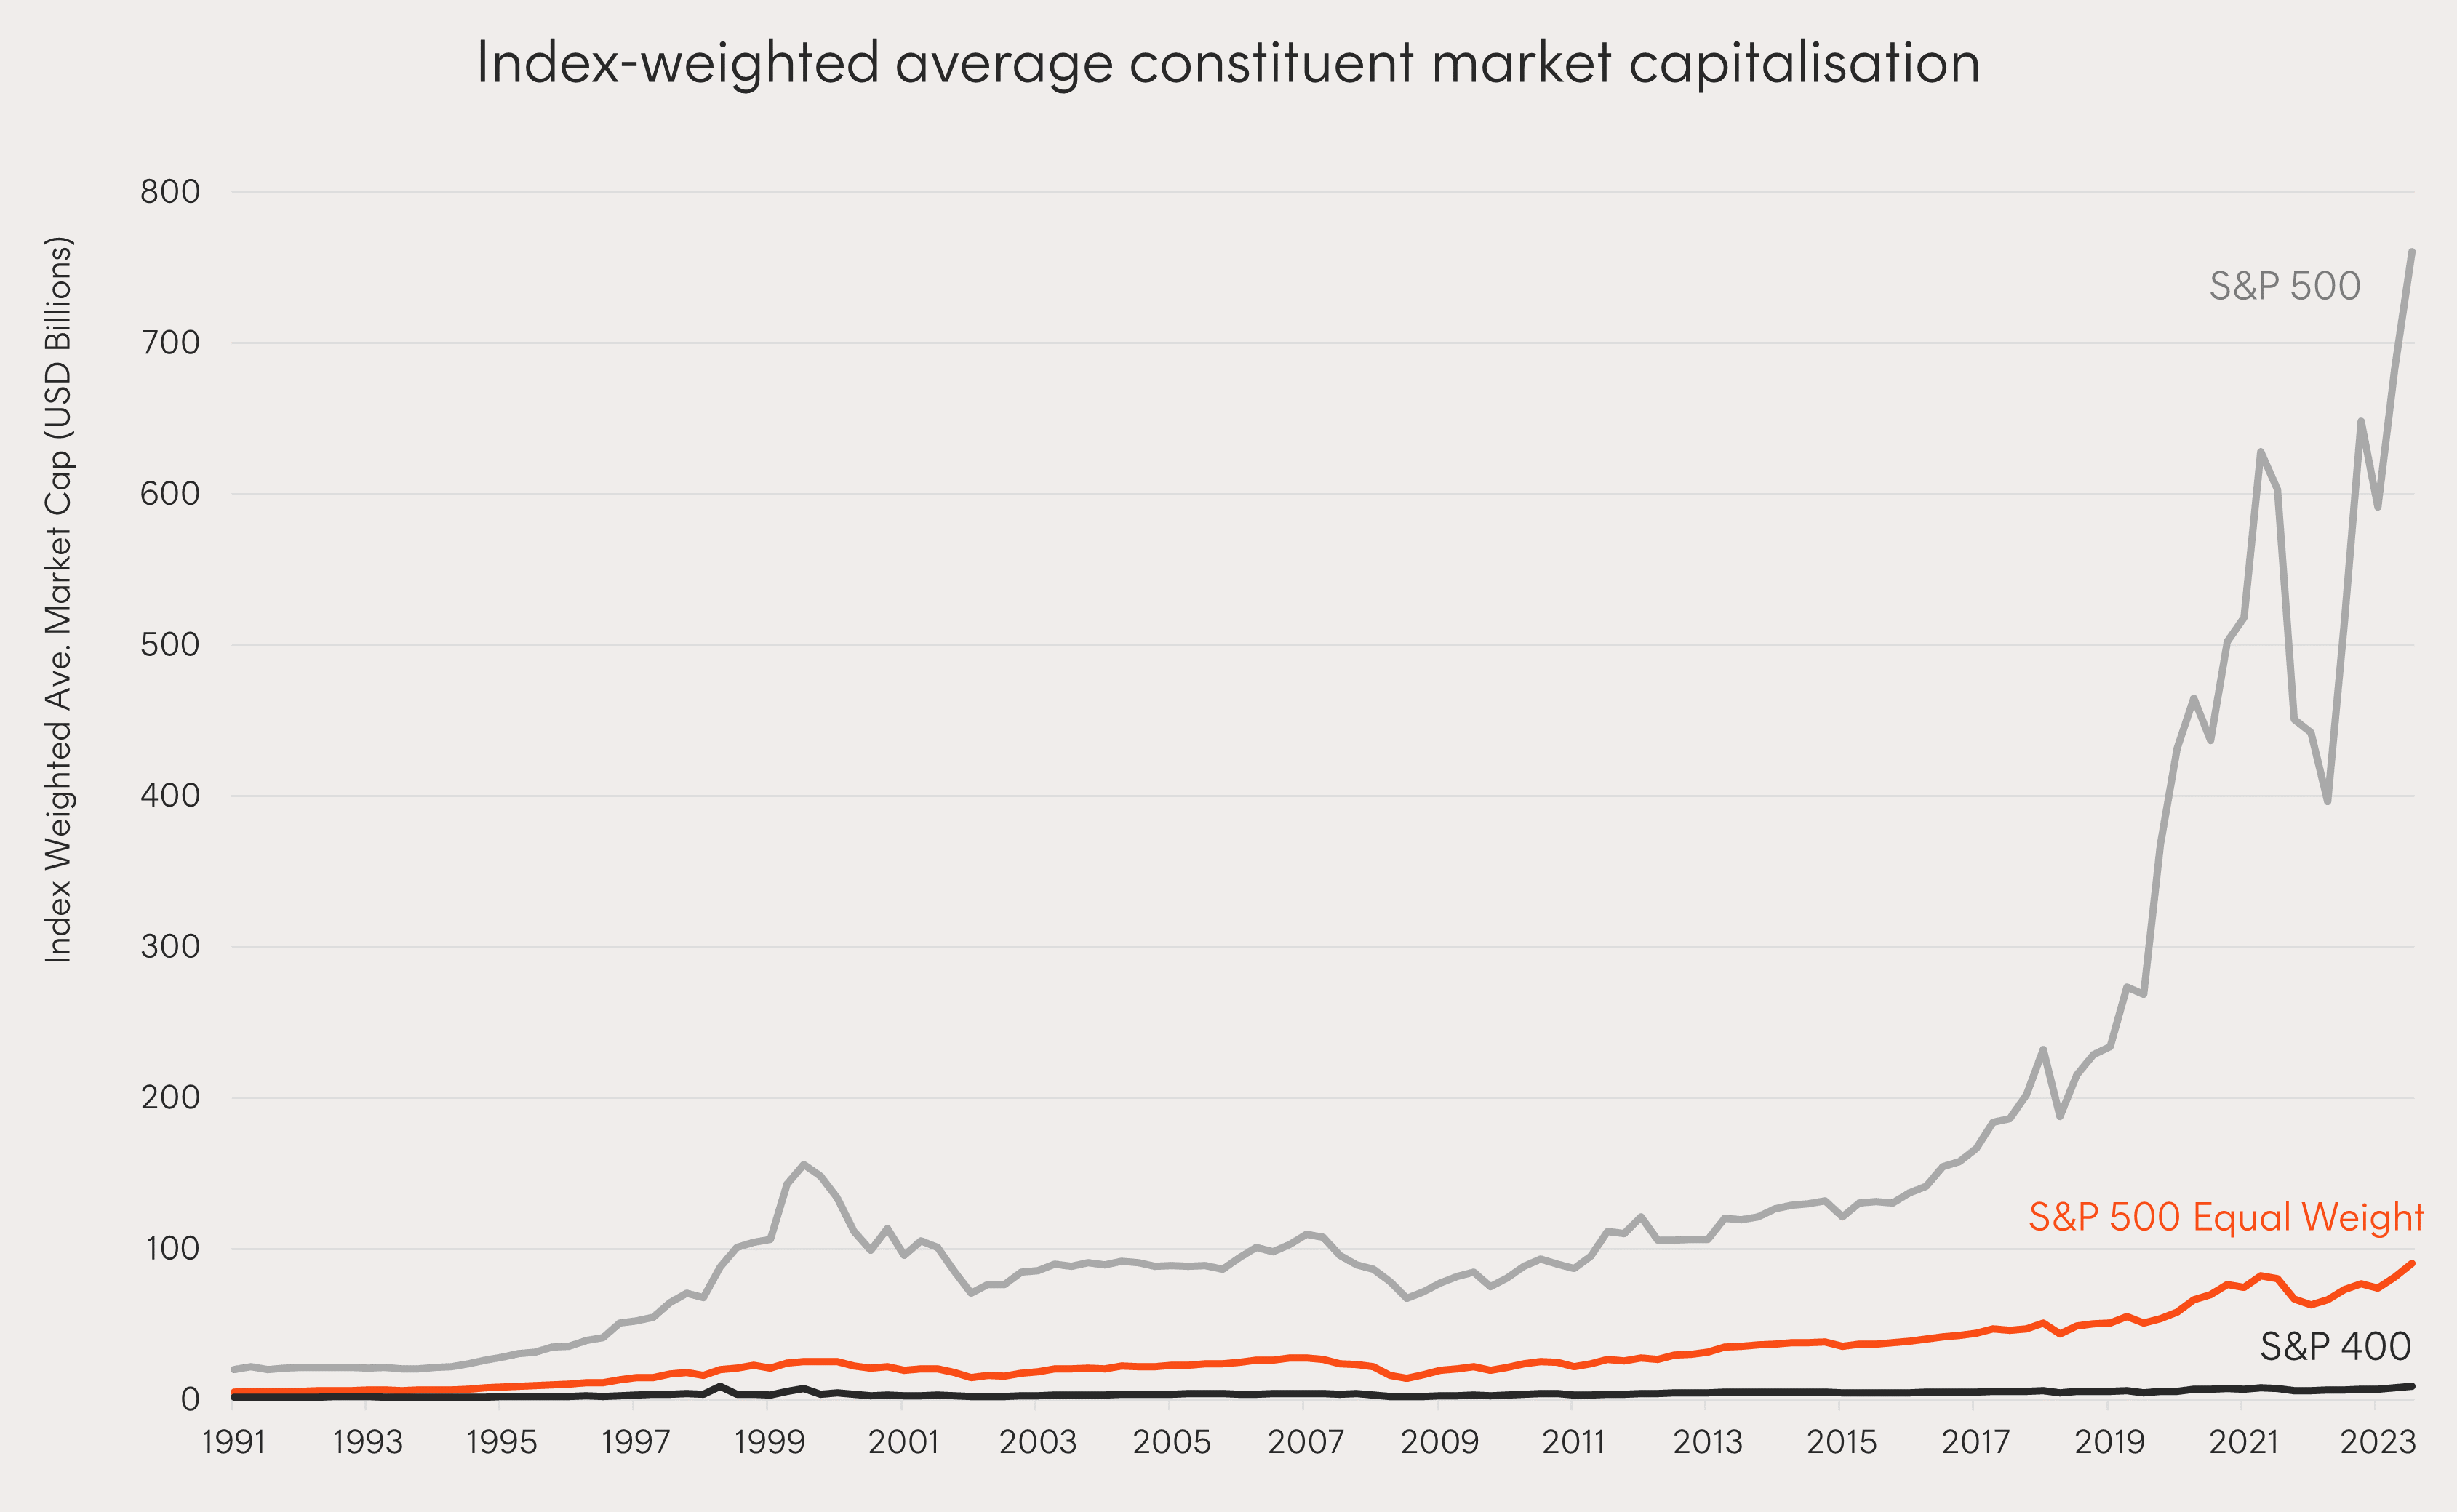
- The SPX weighted average market cap is rapidly approaching the USD1tn mark as the size of its largest constituents keep getting bigger. This is particularly remarkable given that only 8 listed companies have ever reached this milestone. Any investors concerned about the sustainability of US mega cap outperformance should be reminded that historically SPEW has had its greatest periods of outperformance over SPX when concentration is high and subsiding.
- Outside of the US, European and UK equity markets remain good value, even after 6 months of strong performance. South Korea, Chinese, and Hong Kong markets also remain cheap, however the latter two remain in multi-year down trends.
- Despite being one of the best performing markets on 1, 3, and 5yr basis and garnering a lot of investor interest and flow this year, Japanese regulators have told corporate boards they must sharpen their focus on shareholder returns. In response we are witnessing improving profitability and growing dividends and buybacks. While the Topix index average price/book ratio has improved to 1.33x, that is still much cheaper lower than other major equity indices, hence further upside potential remains.
Betashares Global Equity Markets Monitor – 28 June 2024

Source: Bloomberg, Betashares. As at 28 June 2024. You cannot invest directly in an index. Past performance is not an indicator of future performance.
Source: Bloomberg. Since Bloomberg data available: March 2010 to July 2027.
Source: Bloomberg, S&P Dow Jones LLC. Quarterly data from December 1991 to March 2024.

Source: S&P Dow Jones Indices LLC, Betashares. Chart shows cumulative relative returns for the S&P 500 Equal Weight Index versus the S&P 500, based on monthly total returns between Dec. 1970 and May 2024. Cumulative weight of largest five S&P 500 companies based on month-end constituents. Past performance is no guarantee of future results. Chart is provided for illustrative purposes and reflects hypothetical historical performance.
Asset Class Correlations
- Stock and bond correlations remained positive during the quarter, in benign market conditions. In our view bonds are well placed to play defense – the US 10yr government bond yield is still at levels last seen pre-GFC – allowing for significant potential yield compression if and when equities come under pressure.
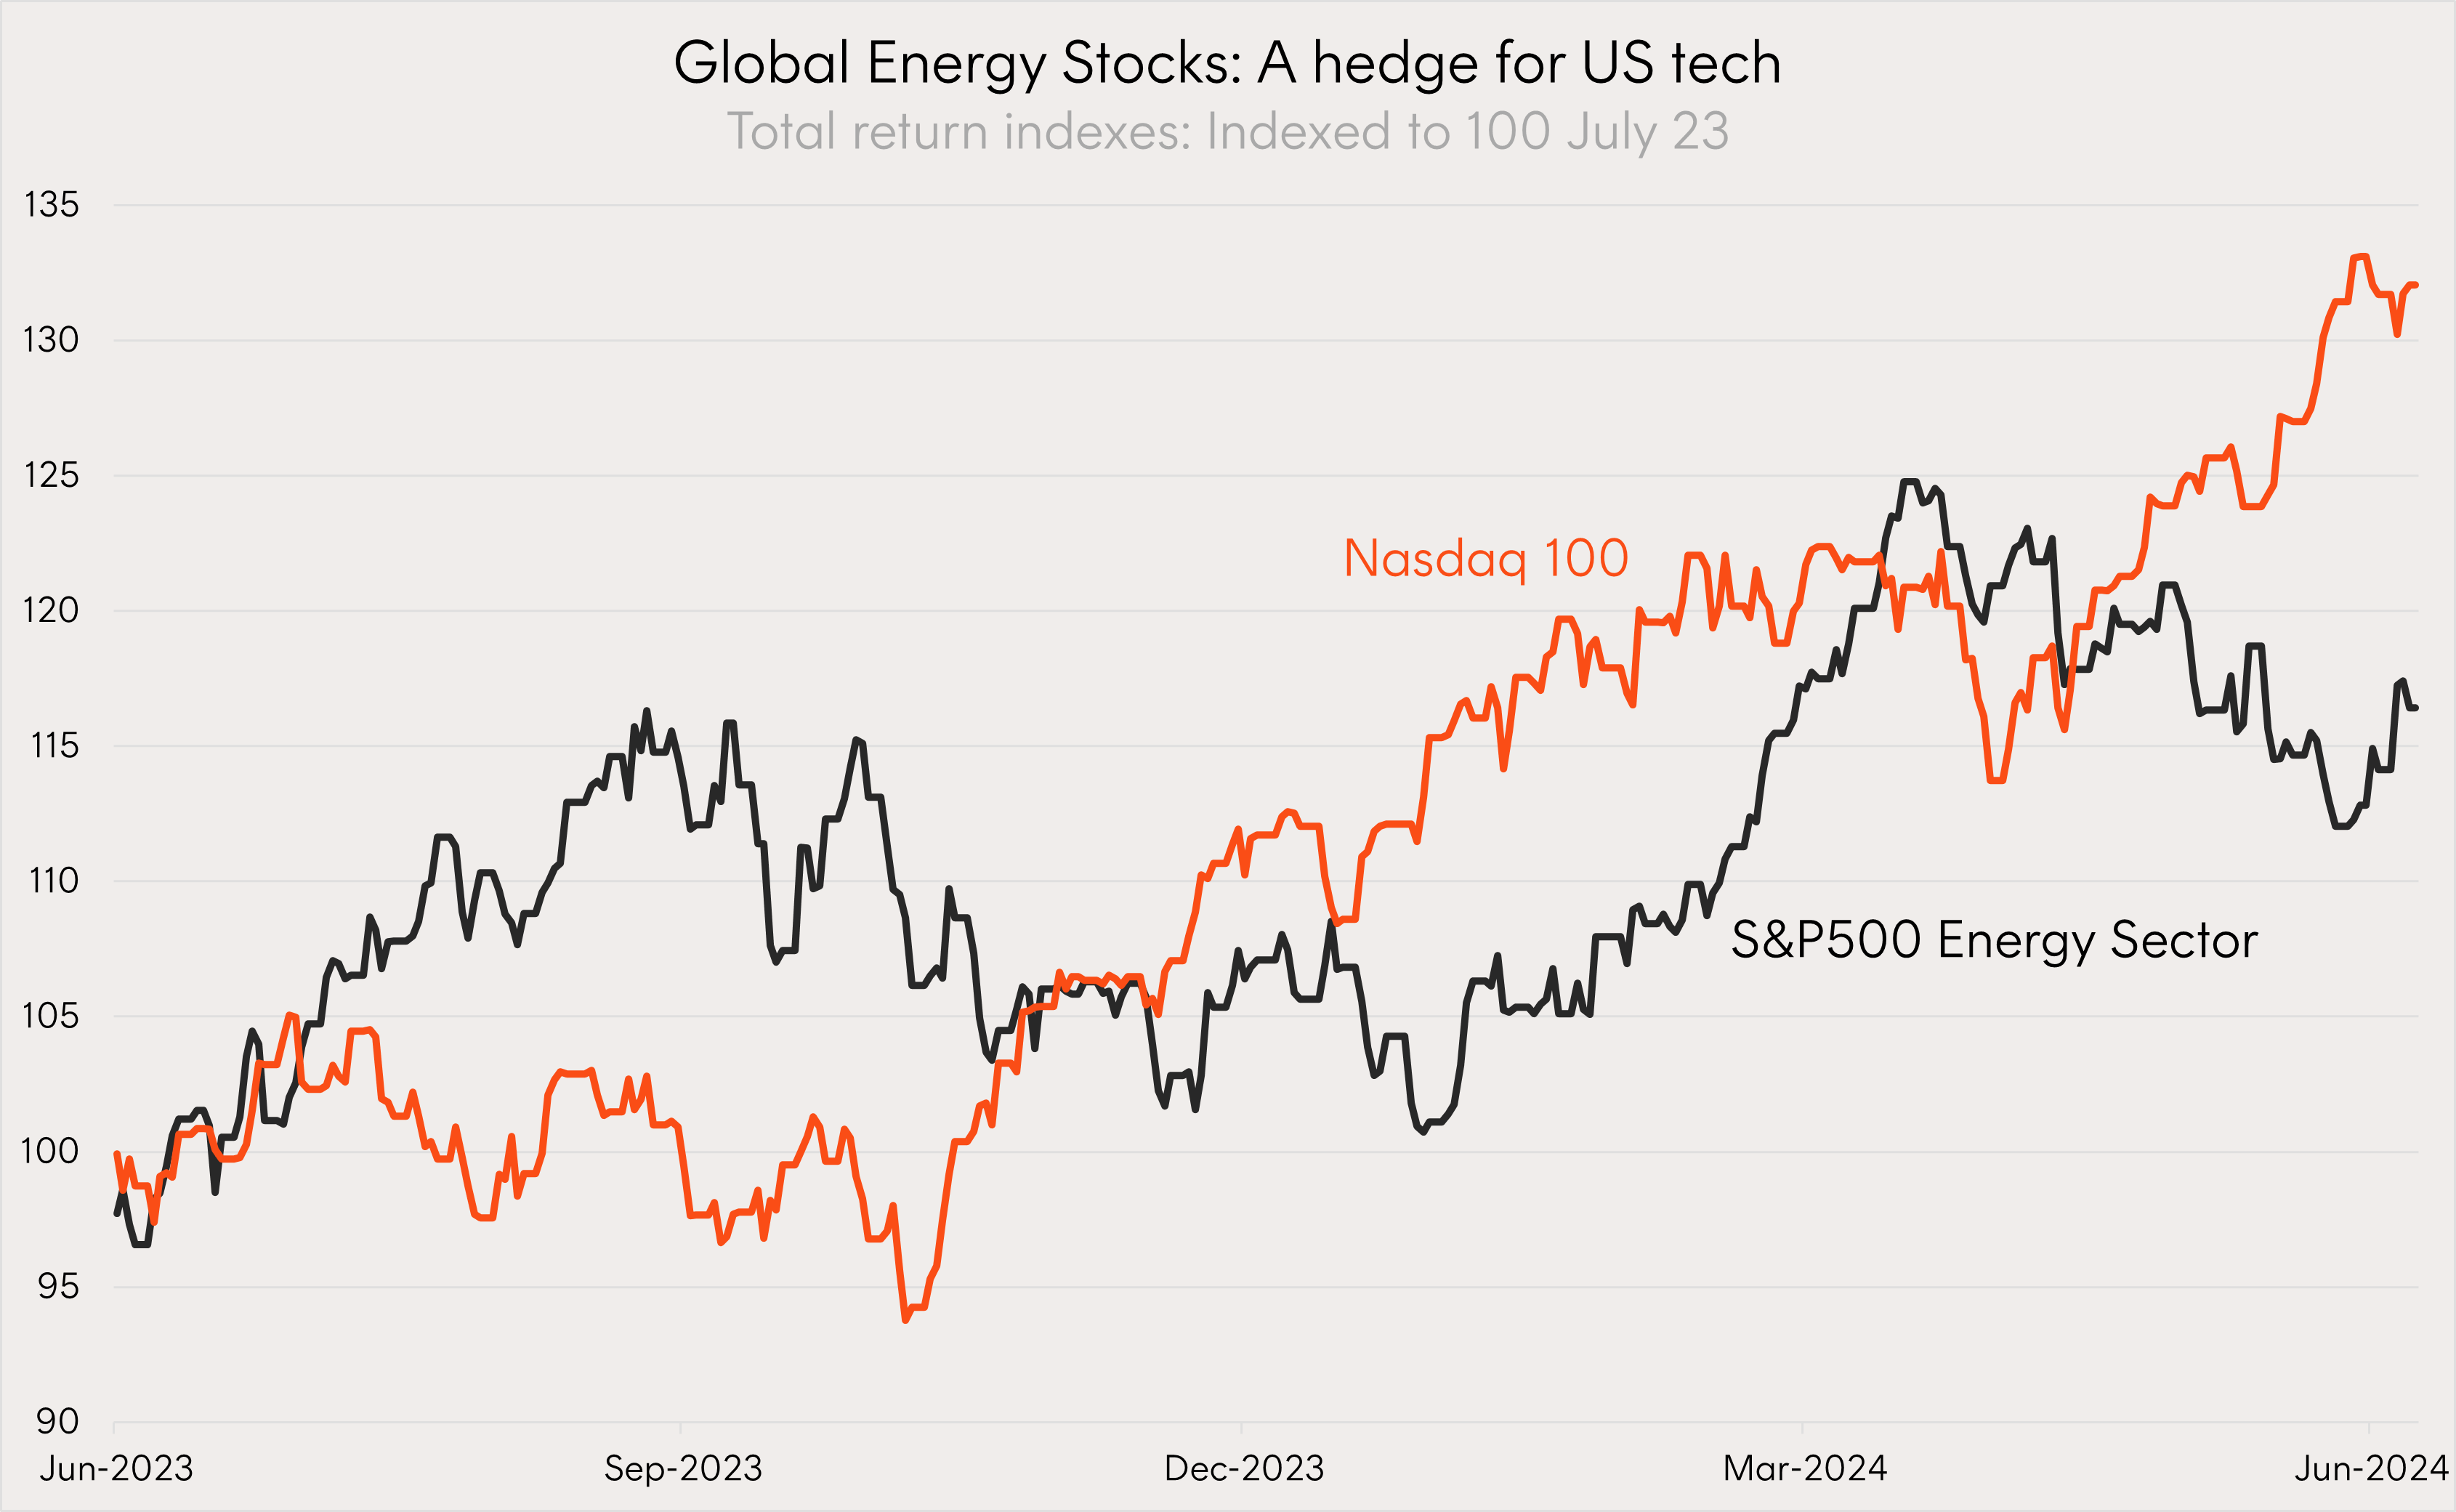
- One of the more useful relationships observed over the past 12 months for asset allocators has been the negative correlations between certain equity sectors, for example technology versus energy.
- Many portfolios may have found themselves overweight to US technology companies given their 12-month performance, with the Nasdaq 100 returning 31% over the period. Energy companies, which have returned 16% over the same period, have experienced their gains at times when tech has sold off, making the energy sector a potentially useful hedge within the equity allocation of portfolios.
Source: Betashares, Bloomberg. July 2023 to July 2024. You cannot invest directly in an index. Past performance is not an indicator of future performance.
Flows
- 2024 is witnessing a resurgence in share buybacks to near the record levels of 2021 and 2022. Apple alone announced a USD110bn buyback program in their most recent quarterly earnings. A similar trend emerged in ASX reporting earlier this year with the ANZ, NAB and WBC announcing a collective $4.5b in share buyback programs.
- The higher buyback activity since 2020 is expected to have played a role in equity market reaching record highs and further buybacks are expected to continue supporting these levels. S&P 500 buybacks over the 5-years from 21’ to 25’ are expected to account for more than 80% of the previous 10-year period, 11’ to 20’.
- Coupled with buyback activity, a dearth of IPOs since 2021 has seen the global supply of public equity shrink at it’s the fastest pace in 25 years. In the US the number of listed companies has fallen from over 7,000 in 2000 to less than 4,000 today – with similar trends in Europe and the UK. This has naturally led to capital flowing to a smaller pool of public companies, supportive of overall prices.

Source: Goldman Sachs Global Investment Research. As of March 24’.
Betashares Capital Limited (ACN 139 566 868 / AFS Licence 341181) (“Betashares”) is the issuer of this information. It is general in nature, does not take into account the particular circumstances of any investor, and is not a recommendation or offer to make any investment or to adopt any particular investment strategy. Future results are impossible to predict. Actual events or results may differ materially, positively or negatively, from those reflected or contemplated in any opinions, projections, assumptions or other forward-looking statements. Opinions and other forward-looking statements are subject to change without notice. Investing involves risk.
To the extent permitted by law Betashares accepts no liability for any errors or omissions or loss from reliance on the information herein.