
James Fennell
8 minutes reading time
When it comes to building wealth in Australia, shares and property often spring to mind. However, choosing between the two can often be difficult given their suitability will depend on an investor’s preference for liquidity, leverage and costs.
While property has long been heralded as a popular way to build wealth for many decades, the increasing accessibility of shares through vehicles like ETFs have provided another avenue for Australians to build long-term wealth.
With many ‘priced out’ of the property market due to skyrocketing prices, and a potential reduction on the 50% capital gains tax discount on investment properties – is property still the go to wealth-building vehicle it is so often assumed to be?
What the data shows
To answer this question, we conducted a hypothetical comparison of the outcomes of investing in property versus investing in the share market, using historical return data for the 10-year period ending September 2025.
The property investor1:
For the property investor we considered a strategy called “rentvesting”, where you rent a home in your desired location while buying an investment property in a more affordable area. As property has become increasingly out of reach for many Australians, this approach has gained in popularity. It opens up the possibility to gain a foothold in the property market earlier and the potential benefit of negative gearing. We modelled the cashflows and returns based on the September 2015 median Sydney house price, purchased using a mortgage with a 25% deposit. In this analysis we factor in rental income, costs, loan repayments and tax effects for the subsequent 10 years to September 2025.2
The share market investor:
Then we took the upfront and ongoing cashflows that the property investor would have paid/received over that period and modelled the outcome if instead they had been invested in the share market. In this analysis we assume the investor does not use gearing, they elect to reinvest distributions, and we factor in tax payable assuming they are eligible for franked credits.
Firstly, we model the returns of this investment strategy using the S&P/ASX 200 index less a 0.04% p.a. management fee over the ten years to September 2025, as a proxy for a low-cost diversified ETF exposure to the Australian share market.
For good measure we repeat this exercise using the MSCI World index less a 0.08% p.a. management fee over the ten years to September 2025, as a proxy for a low-cost ETF exposure to the global share market.
The simulated growth in the capital of the property investor, and the Australian and global share market investors over the ten years, are shown in the chart below, and assuming no capital gains realisation.
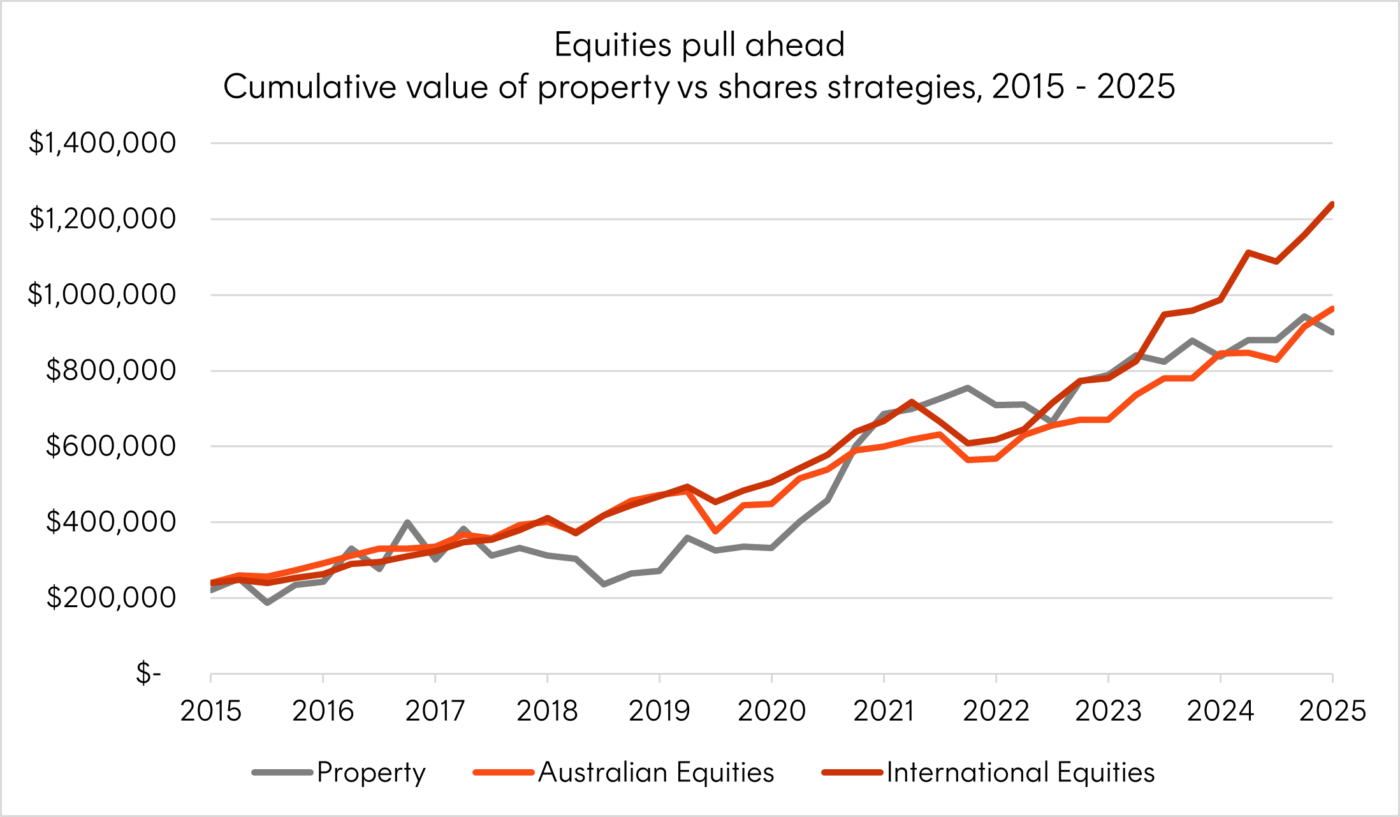
Source: Betashares, Bloomberg, ABS. As at 30 September 2025. Past performance is not a reliable indicator of future performance. Further details on the methodology and assumptions used for this model can be found at the end of this article.
For completeness, we also calculate the final values after 10 years, assuming the assets are disposed of and capital gains tax is payable in September 2025. In this analysis we factor in an sellers agent fee of 2.5% for the property investor.
| Strategy | Value after 10 years | vs. Property |
|---|---|---|
| The Property Investor (using Sydney median prices) | $780,056 | — |
| The share market investor – Australian Equities | $854,388 | +$74,332 |
| The share market investor – International Equities | $1,090,070 | +$310,014 |
Source: Betashares, Bloomberg, ABS. As at 30 September 2025. Past performance is not a reliable indicator of future performance. Further details on the methodology and assumptions used for this model can be found at the end of this article.
In summary, based on this hypothetical the Australian equities strategy accumulated ~$74,000 more than the investment property however without the debt, illiquidity or concentration risk that accompanies leveraged property. The international equities strategy extended that advantage to around $310,000. Neither result dismisses property as a long-term asset — but both challenge the premise that it is the superior default path for wealth accumulation.
Where property fell short: the hidden cost of property investment
To understand why property underperformed, it is helpful to understand where the costs accumulated. Sydney investment property has long been championed for its leverage-enhanced capital growth, but the input assumptions have shifted materially. Rental yields on Sydney houses now sit at just around 3% down from close to 5% in the early 2000s, while median prices have risen to median of ~$1.75 million in February 20263, approximately 13-14 times the median household income in Australia.
Additionally, over the 10-year modelled period, the investment property in the hypothetical would have accrued around $410,000 in interest (based on actual interest rates over the 10-year period) — nearly four times the ~$104,000 of principal repaid — alongside ~$125,000 in associated property costs (e.g., management fee, maintenance and insurance costs). While the rental income of ~$360,000 offset a portion of these, total expenses exceeded rent in every single period, leaving the property negatively geared throughout the comparison period. Leverage amplifies gains in rising markets, but also increases the cost drag of low rental yields.
Beyond returns: the structural advantages of shares
While the simulation results are compelling for equities, its advantages extend well beyond raw performance. For younger Australians in particular, many of whom face genuine barriers to property entry and may need more capital accessibility over the years ahead, the following key structural characteristics of shares/ETFs may matter even more.
Accessibility:
- Broad-market ETFs can be accessed with minimal capital and zero transaction costs, making consistent early investing a reality where property simply is not. A 20% deposit on a Sydney median house price of $1.75 million4 represents $350,000 before stamp duty and legal costs — that’s a massive barrier that excludes a large proportion of younger investors from property altogether.
Liquidity and flexibility:
- ETFs can generally be liquidated with ease throughout market trading hours. This means any portion of a portfolio can be drawn upon to meet an emergency expense or to meet other unexpected circumstances. Meanwhile, property typically takes months to sell and incurs material transaction costs like seller agent fees which average anywhere between 2-3%.
Diversification:
- A single investment property concentrates capital into one asset in one suburb, exposing it to factors like zoning changes and other unforeseen structural issues. Broad equity ETFs distribute that exposure across hundreds of companies, multiple sectors and in the case of global funds dozens of countries. The risk profile of a diversified equity portfolio is materially different from a leveraged single-property holding. That distinction is frequently absent from the conventional property-versus-shares debate.
Conclusion
The case for investment property as the default wealth-building vehicle for young Australians may not be as strong as it was in the past. Sydney rental yields have more than halved since the early 2000s, entry prices have climbed to record highs, and the federal government is actively considering reducing the CGT discount which reduces the asset class’s after-tax appeal, all else equal. Together, these shifts have compressed the return profile for new entrants in a way that headline capital growth figures published in the media do not fully capture.
Our hypothetical simulation shows that deploying the same cash flow into a diversified equity strategy — whether through Australian or global shares (even after management fees) produced a materially better 10-year outcome than a Sydney investment property, without the leverage, illiquidity or concentration risk that property entails. Beyond the returns, accessing equities through an ETF vehicle also ease of access, liquidity and diversification characteristics that are frequently overlooked in the property debate.
Property remains a legitimate long-term asset, and its role in a diversified portfolio should not be dismissed. However, there are other approaches such as investing through the share market that have provided many Australians a powerful, yet accessible alternative to building wealth over the long term
| Category | Detail |
|---|---|
| Purchase date & price | Sydney median house price, $888,200 as at 30 September 2015 (ABS) |
| Initial deposit | 25% of purchase price (property); equivalent cash deployed into equities |
| Mortgage | 30-year term, variable rate at the RBA’s published investor rate |
| Rental income | Domain median Sydney house rent indexed to ABS CPI % quarterly change in Sydney rent |
| Property expenses | 35% of rent expensed for management fees, maintenance, council & water rates, insurance and vacancy |
| Excluded property costs | Land tax and depreciation (deductions available for properties built after 15 September 1987 which could improve after-tax capital returns) |
| Tax treatment | Rental income and negative gearing credits at marginal rate of 30%; dividends taxed before reinvestment |
| Australian equities series | ASX 200 index — total return less fees (0.04% p.a. for the Betashares Australia 200 ETF) with after-tax dividends reinvested |
| International equities series | MSCI World index — total return less fees (0.08% p.a. for the Betashares Global Shares ETF) with after-tax dividends reinvested |
| Cash flow matching | The same total cash outflow incurred by the property each period is invested into equities |
| Seller agent fee | 2.5% |
| Holding period | 10 years (from 30 September 2015 to 30 September 2025) |
| Franking percentage | 75% (to calculate franking credit on dividends received from Australian shares) |
Disclaimer:
The hypothetical examples provided in this article are for illustrative purposes only. It does not represent the actual returns of any investment and does not take into account all the potential fees and costs involved. Actual outcomes may differ materially. This information is not a recommendation or offer to make any investment or adopt any particular investment strategy. Simulated past performance is not indicative of future performance of any investment or strategy.
Future outcomes are inherently uncertain. Actual outcomes may differ materially from those contemplated in any opinions, estimates or other forward-looking statements given. To the extent permitted by law Betashares accepts no liability for any errors or omissions in, or loss from reliance on this information.
Investing involves risk.
Footnotes:
1. Please refer to the assumptions and methodology table at the end of this article for all the relevant assumptions in respect of the property investor. ↑
2. I.e., the net quarterly cash flow positions for the property (rent – interest – principal – maintenance costs) formed the investment amount for each equities strategy each quarter, in addition to after-tax dividends being reinvested ↑
3. https://www.commbank.com.au/articles/newsroom/2025/10/housing-market-changes-gear.html ↑
4. https://www.commbank.com.au/articles/newsroom/2025/10/housing-market-changes-gear.html ↑
2 comments on this
Hi James,
Thanks for your article on shares vs property.
For property you do not mention stamp duty costs. In Victoria at around 6% of property purchase price this is a real deal breaker!
Otherwise I believe you have presented a balanced article.
I agree shares win on accessibility, liquidity and diversification, but also on lower headaches and stresses from difficult tenants and emergency repair issues.
Keep up the good work!
Regards,
Alan Richardson
Betashares client.
For a longer perspective and REAL returns, here is my experience. Using Excel spreadsheet Internal Rate of Return function (XIRR):
Newtown (Sydney market) one bedroom semi held 35 years 11.4% (no borrowing)
The rest had 105% borrowing because I used a Line of Credit on my Principal Residence –
Toowong, QLD one bedroom unit held 21 years, IRR +6.6%
Bundamba (Ipswich), QLD one bedroom retirement unit held 17 yrs, IRR minus 1%
Upper Mount Gravatt, QLD 2 bedroom townhouse held 14 yrs, IRR minus 1.3%
Clayfield, QLD 2 bedroom unit held 19 years, IRR minus 7.7%
Sanctuary Lakes (Point Cook), VIC 4 bedroom house and land held 18 yrs, IRR minus 5.9%
By comparison, I have also dabbled in shares for 26 years and even with all the dud companies I owned, GFC and COVID years, my IRR is +14.8%
As a result, I have sold all my properties (the above IRRs include the CGT paid) and adding to my share investments.
Regards,
Max