
Currency hedged, tax exposed: is history about to repeat?

Chamath De Silva
8 minutes reading time
Related articles

Commentary from the Betashares portfolio management desk by Head of Fixed Income Chamath De Silva, providing an overview on fixed income markets:
- Markets are transitioning from soft vs hard landing debates to trading the cyclical acceleration, with bond market volatility magnified on policy uncertainty following the US election.
- Rising Japanese yields, French sovereign spreads hitting decade highs, and inverted 10-year swap spreads in multiple regions highlight the structural shifts taking place.
- With credit markets coming under strain at a time that equity markets remain buoyant, multi-asset investors may be better served using fixed income for portfolio insurance rather than chasing yield.
A new narrative
I’d like to start with a line I’ve been using at recent client events across: we should retire the whole soft landing vs hard landing framework. Markets are forward-looking and have clearly shifted focus to what comes next, which appears to be the next cyclical acceleration. The Federal Reserve, in both its words and actions, also seems to have accepted that the soft landing has occurred, with inflation returning to a level consistent with an easing of policy (from restrictive to neutral) without any major damage to the labour market.
Bond yields are still on a rollercoaster, with the US election result injecting fresh policy uncertainty into the mix, pushing 10-year US Treasuries to retest 4.5% (and 10-year ACGB yields to 4.7% in sympathy). Over the past fortnight, we’ve seen an aggressive retracement on optimism that the nominee for Treasury Secretary would take a more fiscally cautious approach and dial down the more inflationary aspects of Trump’s policy proposals. However, the removal of recession risk and the still-resilient labour market continue to present some cyclical challenges for duration over the medium term.
While the US rates environment is crucial to global bonds, I’d like to shift the focus of this piece to some other developments that caught my attention: namely, Japanese long-term government yields trading above Chinese equivalents, French sovereign yields now exceeding those of Spain and even matching Greece, and 10-year swaps spreads inverting in several markets. These developments highlight the inflection point we are at, both for global macroeconomics more broadly and for credit markets, which are showing wobbles as we head into year-end.
Chart 1: benchmark bond yields
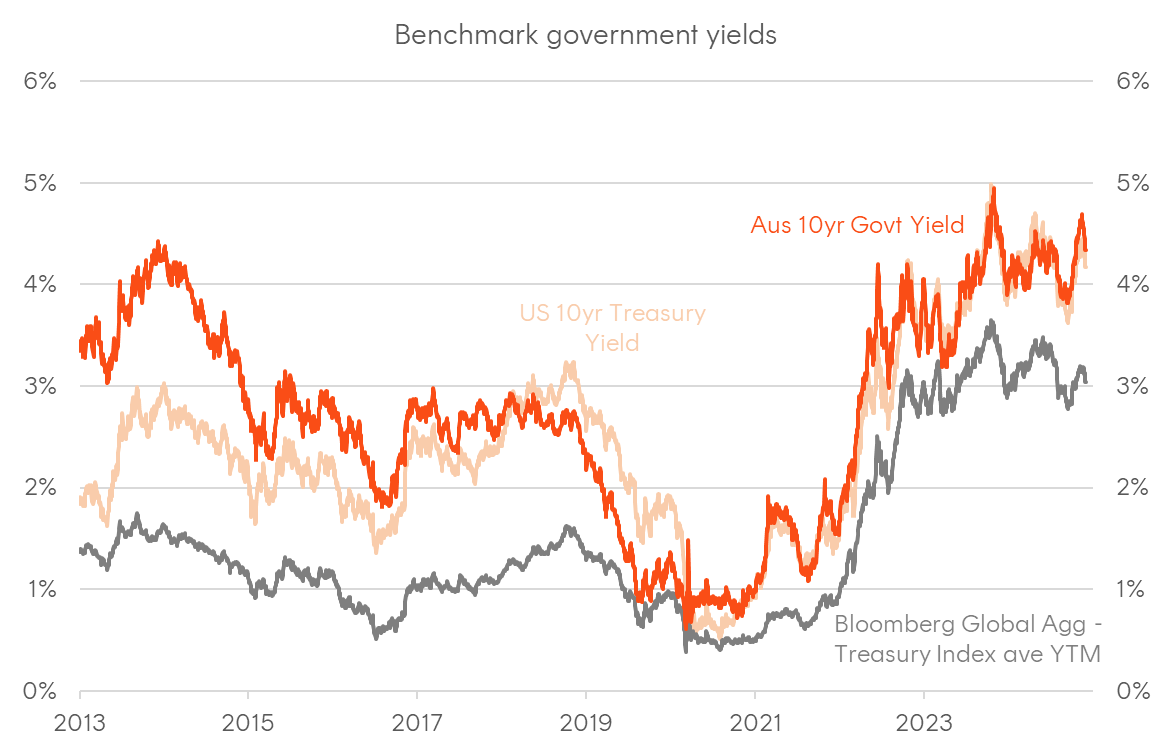
Source: Bloomberg
Turning Japanese
With most macro commentary still focused on the Federal Reserve and the question of where the “terminal” rate will be this cycle, it’s worth remembering that we have a Bank of Japan meeting this month that may deliver another rate hike—the third in its first hiking cycle since the mid-2000s. Coinciding with these growing expectations has been a push higher in long-term JGB yields, which recently traded above Chinese government bond (CGB) yields in the 30-year sector for the first time ever, continuing a broader trend of divergence over the past five years.
With the impact of September’s much-hyped Chinese fiscal stimulus announcements now completely faded in the CGB market, many are asking whether China is indeed mired in the kind of “balance sheet recession” that plagued Japan’s economy in the 1990s and 2000s, where an unrelenting private sector deleveraging dominated.
However, another perspective is that Japan is turning a corner, supported by a very weak currency and a shift in US trade policy favouring allies in the Asia-Pacific region. Unlike many sovereign curves that inverted during the 2022–2023 hiking cycle, the JGB curve remains very steep, reflecting longer-term optimism about nominal growth expectations and a cautious approach to policy normalisation from the BoJ. This steep yield curve is likely to remain self-reinforcing, driving bank lending in Japan’s banking-dominated credit system and further fuelling investment and economic activity more broadly, with the export sector remaining robust while the yen remains significantly undervalued by most fundamental metrics.
With many structural and cyclical tailwinds in place for above-trend nominal growth to persist in Japan, it’s likely we’ll see JGB yields continue to rise. This would have significant implications for global bonds and investment flows, given Japan’s status as the world’s largest creditor to the rest of the developed world.
Chart 2: 30-year JGB yields now trading above Chinese equivalents
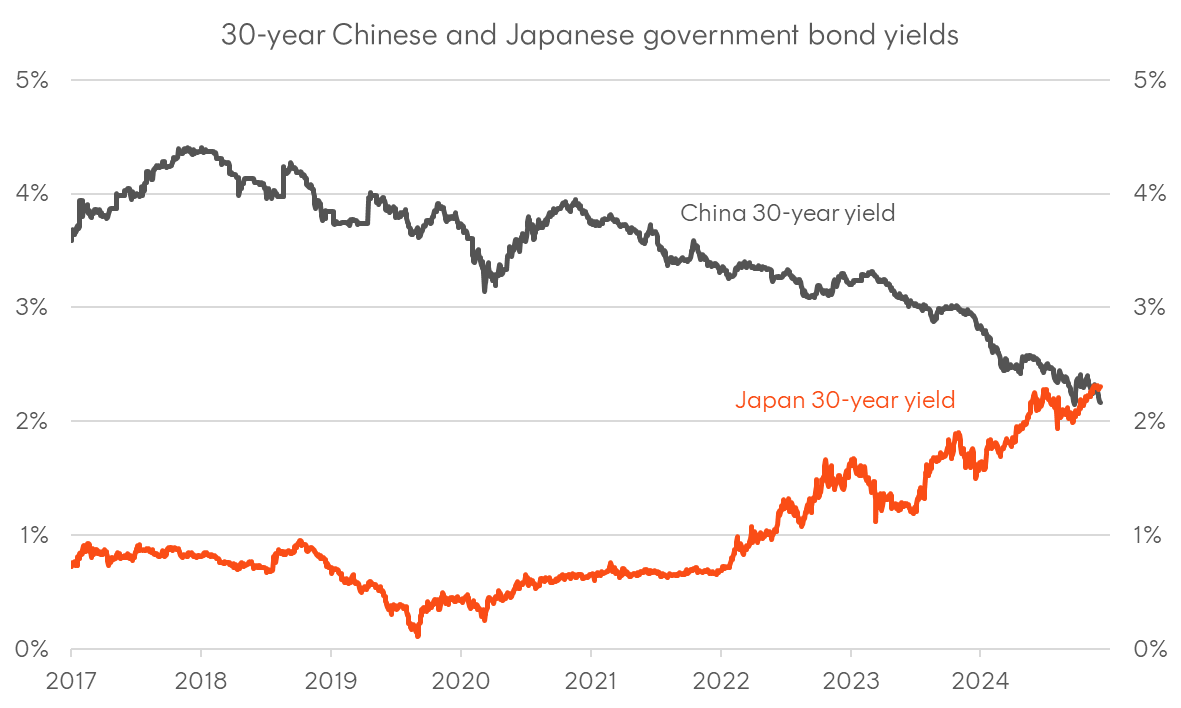
Source: Bloomberg
The French connection
Ten-year French spreads have come under fresh scrutiny in the past fortnight amid fears that the populist RN party will derail the government with a no-confidence vote over the latest budget. This mirrors the impasse earlier this year when President Macron’s gamble on calling fresh parliamentary elections initially appeared to pay off. However, this time he lacks the ability to call snap elections (the earliest date for fresh parliamentary elections is June 2025). Consequently, French spreads have reached fresh cycle “wides,” and the highest levels since the European debt crisis in the early 2010s.
The fact that French 10-year yields now trade above Spain and align with Greece is noteworthy but unsurprising, given fiscal trends in recent years. For Australian investors, this development is significant due to its potential spillover effects on investment-grade credit markets. AUD credit is already trading “heavy,” with dealers carrying significant inventory following elevated new issuance. Year-end funding pressures typically worsen this situation. Wider French peripheral spreads have also spilled over to our “Kangaroo” market, with a notable spread widening seen in AUD-denominated French financials.
Chart 3: 10-year Eurozone sovereign spreads to Germany
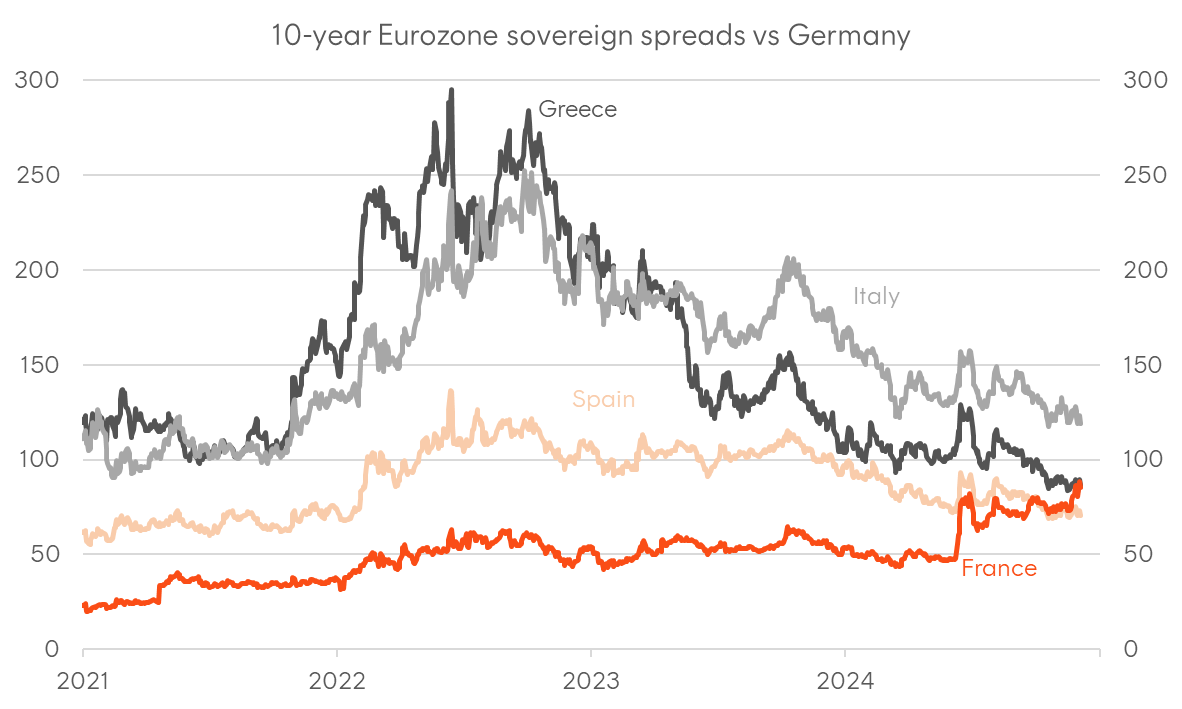
Source: Bloomberg
Under the surface of the bond market
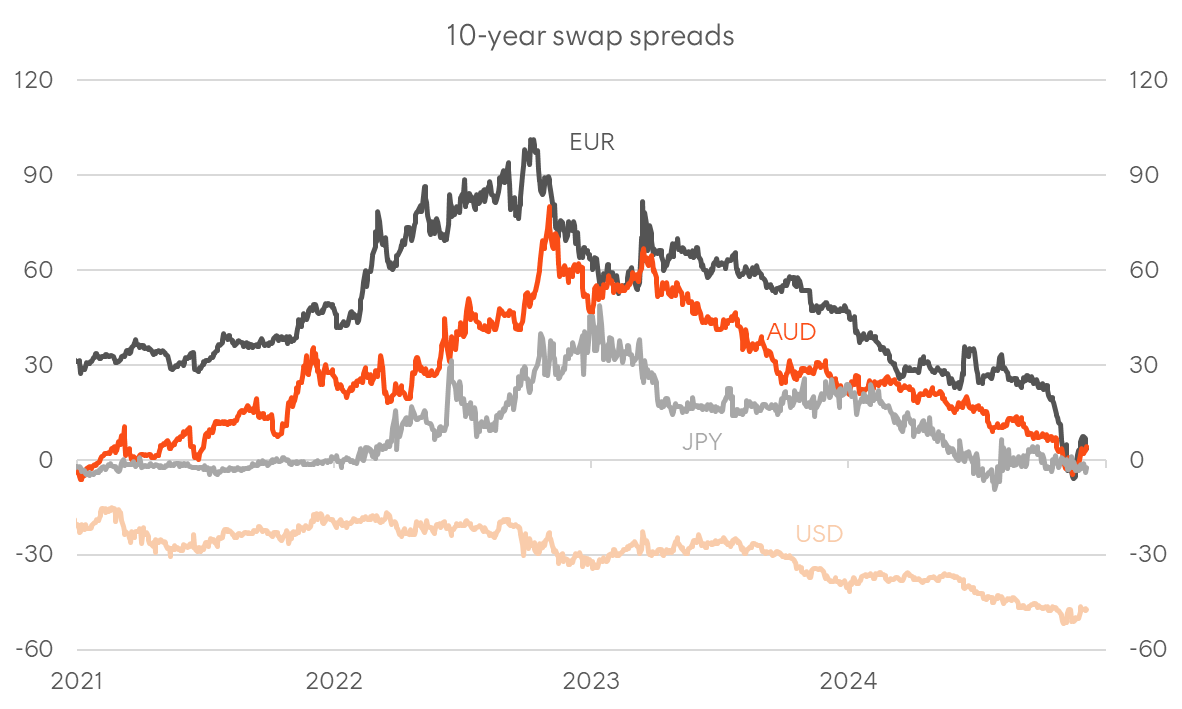
One common indicator of bond market liquidity is the spread between swap rates and benchmark government yields. Both types of instruments are considered free of credit risk in the era of central clearing for OTC derivatives, meaning the difference primarily reflects the balance sheet costs of carrying physical versus synthetic duration, as well as the relative scarcity of government bonds. For a considerable time, US dollar swap spreads were inverted (with Treasury yields trading above equivalent OIS rates), but recently, we’ve seen 10-year swap spreads invert in both the Eurozone (vs German Bunds) and Australia.
During the post-pandemic QE period, AUD swap spreads were highly positive (swap rates trading above Commonwealth yields), driven by the artificial scarcity imposed by the RBA. However, with quantitative tightening now in effect and the RBA transitioning from a policy of “abundant reserves” to “ample reserves,” this artificial scarcity has shifted to elevated market tightness.
When government bonds trade cheaper compared to swaps on tighter liquidity conditions, corporate credit tends to show the same trend, with the cost of warehousing risk becoming more expensive. The key takeaway is that dealers are carrying significant corporate credit inventory into year-end following an unprecedented corporate issuance wave domestically, and with balance sheet and funding pressures rising, a further widening of credit spreads in the coming weeks would not be surprising.
Chart 4: Selected 10-year swap spreads
Source: Bloomberg
Can equities rally alongside wider credit spreads?
With the macro backdrop supportive of equities but credit markets showing signs of weakness, this is a fair question. Typically, wider credit spreads coincide with equity market weakness, given both are “risk-on” expressions. However, there are precedents for equities rallying despite wider credit spreads, with the mid-to-late 1990s dot-com bubble being the most memorable example. Back then, the US economy’s strong outperformance coincided with the Asian Financial Crisis and the Russian debt crisis, which were roiling credit markets.
While the empirical evidence exists, there is also a theoretical underpinning based on options theory. Assuming a company’s assets are funded by either debt or equity, owning the “credit” can be likened to a “short put” option on the company’s assets, while owning equity resembles a long call option. In an environment of elevated macro volatility but high corporate profit growth, credit can suffer, while equities can benefit. During the late dot-com period, equities rallied even as the VIX trended higher.
While there are compelling reasons to be long equities given the supportive growth backdrop and expected deregulation under the incoming US administration, an equity melt-up is not the environment to overweight credit for multi-asset portfolios, given where spreads currently are. With US equity valuations arguably rich and the return correlation between stocks and government bond now negative, defensive portfolios should skew towards assets offering portfolio insurance, diversification, and rebalancing benefits during the next major deleveraging event or “carry trade unwind”.
Chart 5: AUD and USD 5-10-year credit spreads vs government

Source: Bloomberg
Chart 6: US equities rising with higher vol between 1995 and 1997
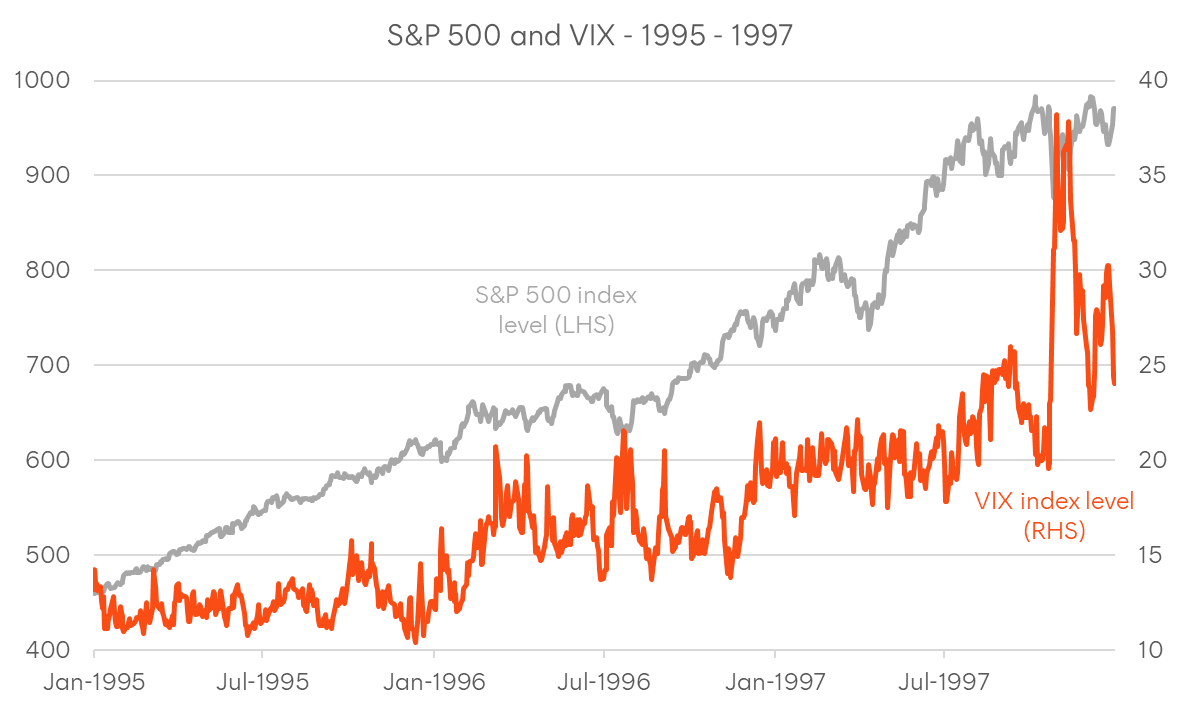
Sources: Bloomberg, CBOE
Chart 7: 1-month rolling daily return correlation between US Treasuries and S&P 500
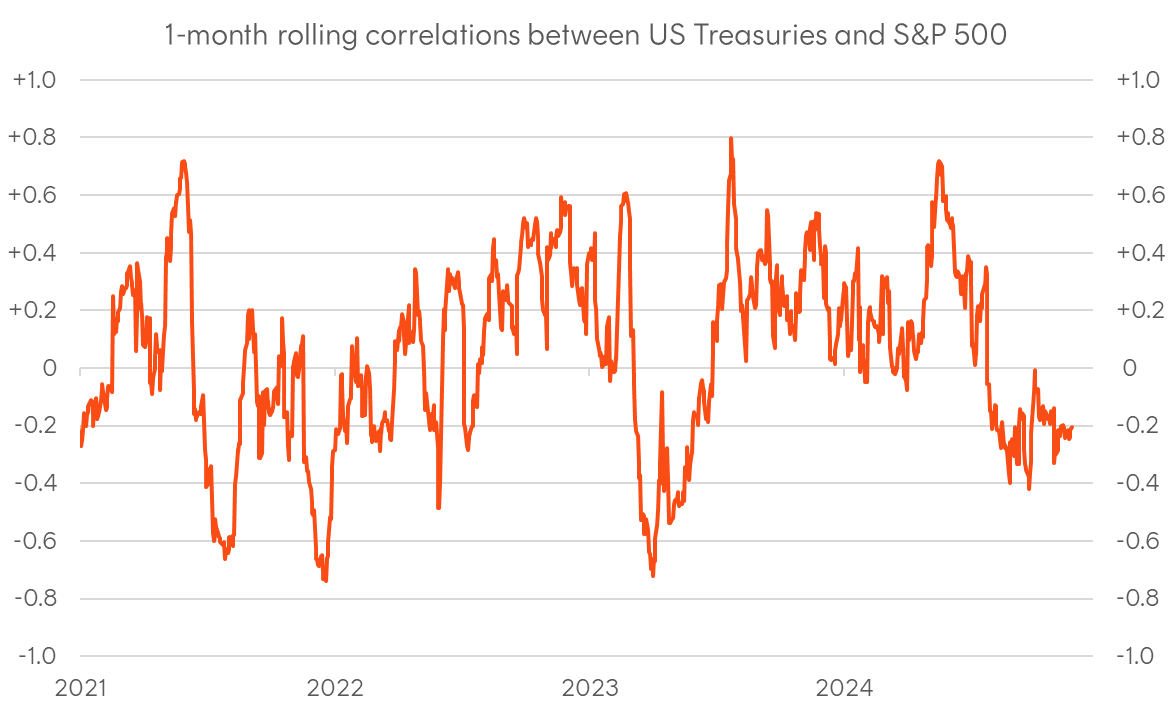
Sources: Bloomberg, CBOE