
Hugh Lam
5 minutes reading time
A wrap up of the charts catching our eye over the past month.
The fallout from Liberation day dominated headlines in April with US equities, the USD and US Treasuries all declining in value as investors sold dollar-denominated assets. The “credibility deficit” weighing on US assets has seen global shares extend their gains this year.
Down under, Australians head to the polls this Saturday for the federal election where cost of living pressures will be front of mind. And, has this affected the demand for chocolate bars over Easter?
Find out more in this edition of Charts of the Month.
1 – Double trouble
Major US stock indexes continued their fall in the month of April while the US Dollar slid to a three-year low, with policy uncertainty from the White House triggering this flight away from American assets.
Due to its safe haven status, the US Dollar typically rises during periods of stress in the share market. However, this relationship has decoupled over the first 100 days of Trump’s second presidency.
Chart 1: Monthly returns for Bloomberg U.S. Dollar Index and S&P 500

Source: Bloomberg. As at 22 April 2025.
2 – The Great Repatriation
Relative to the rest of the world, US shares have significantly underperformed within the first four months of 2025 to levels not seen since the GFC.
Whilst the US is focused on reducing its almost $1 trillion trade deficit and fiscal austerity measures through DOGE, Europe and China are expected to stimulate their economies to help offset any damage from tariffs.
It is this divergence in policy that has led to a revival in ‘Rest of World’ outperformance vis-a-vis the US.
Chart 2: Ratio of MSCI USA Index and MSCI World ex USA Index total return (LHS), and MSCI USA Index monthly outpeformance vs MSCI World ex USA Index (RHS) (2005 to 2025)

Source: Bloomberg, as at 24 March 2025. Returns shown in USD terms. MSCI USA Index relative performance rebased to 100 as at 29 April 2005. You cannot invest directly in an index. Past performance is not an indicator of future performance.
3 – Volatility resurges
The VIX index, which measures the market’s expectation of volatility based on S&P 500 index options, surged above 50 on April 8, 2025 to levels last seen during the pandemic and GFC.
The fallout from Liberation Day on April 2nd also sent US. bond market volatility higher as measured by the Merrill Lynch Option Volatility Estimate (MOVE) index. The yield on 10-Year US. Treasury bonds surged 47bps alone in the week ending April 11th.
Chart 3: CBOE Volatility Index (VIX) and ICE BofA MOVE Index year-to-date

Source: Bloomberg. As at 24 April 2025. You cannot invest directly in an index.
4 – To the polls
This Saturday, Australians will head to the polls for the federal election with policies addressing the national cost of living crisis becoming front and centre.
Whilst increases in annual living costs continued to ease across all household types in the December quarter, that level remains elevated due to high mortgage interest payments and rising food and energy prices.
Chart 4: Employee Living Cost Index (LCI), annual movement (%)

Source: Australian Bureau of Statistics, Selected Living Cost Indexes, Australia December 2024
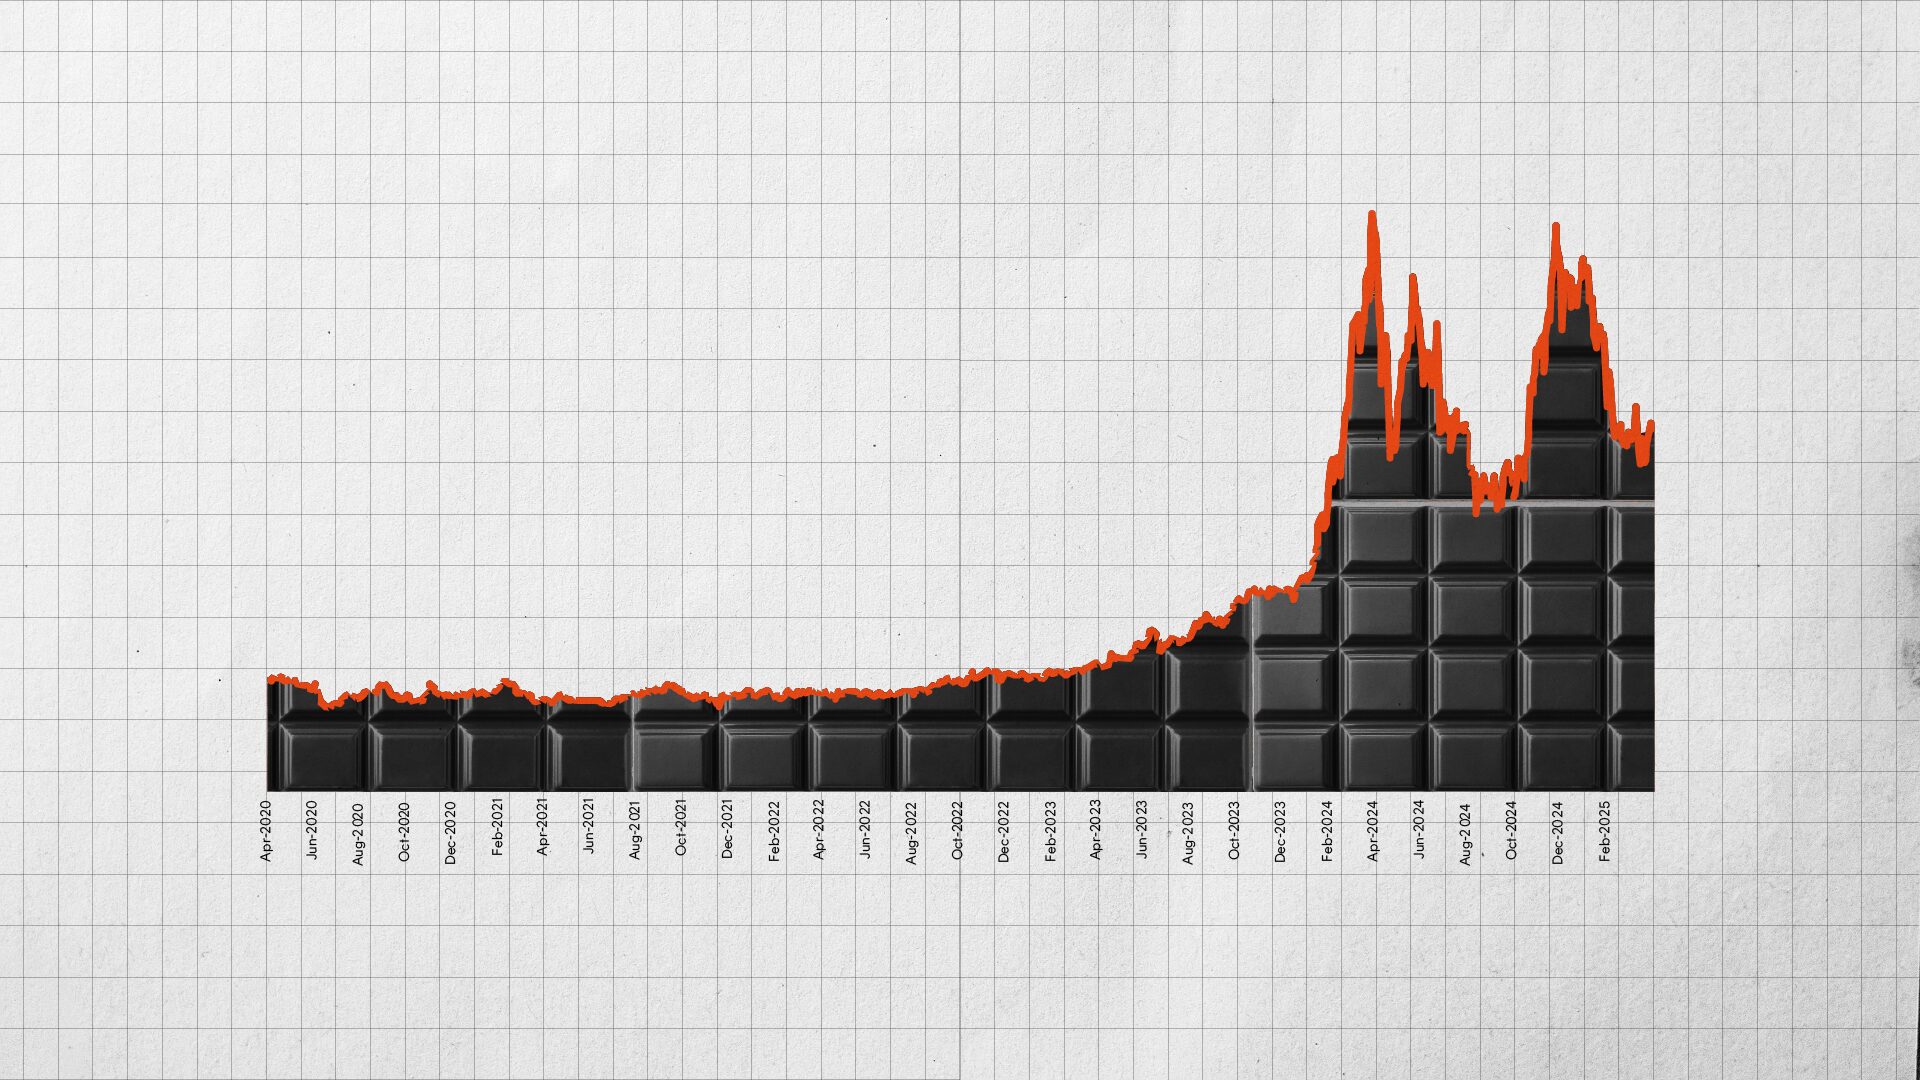
5 – Crazy for cocoa
You may have noticed that the chocolate you bought from the Easter Bunny this year is more expensive thanks to rising cocoa prices. Disease pressures, climate change and bad weather conditions have destroyed crops in West Africa which contributes 80% of the world’s cocoa output.
Whilst prices have come down from their highs of close to $US10,000 per tonne at the start of this year, the price of chocolate is still expected to remain elevated due to underinvestment in cocoa farms and firm consumer demand.
Chart 5: ICE London cocoa futures ($US/tonne)
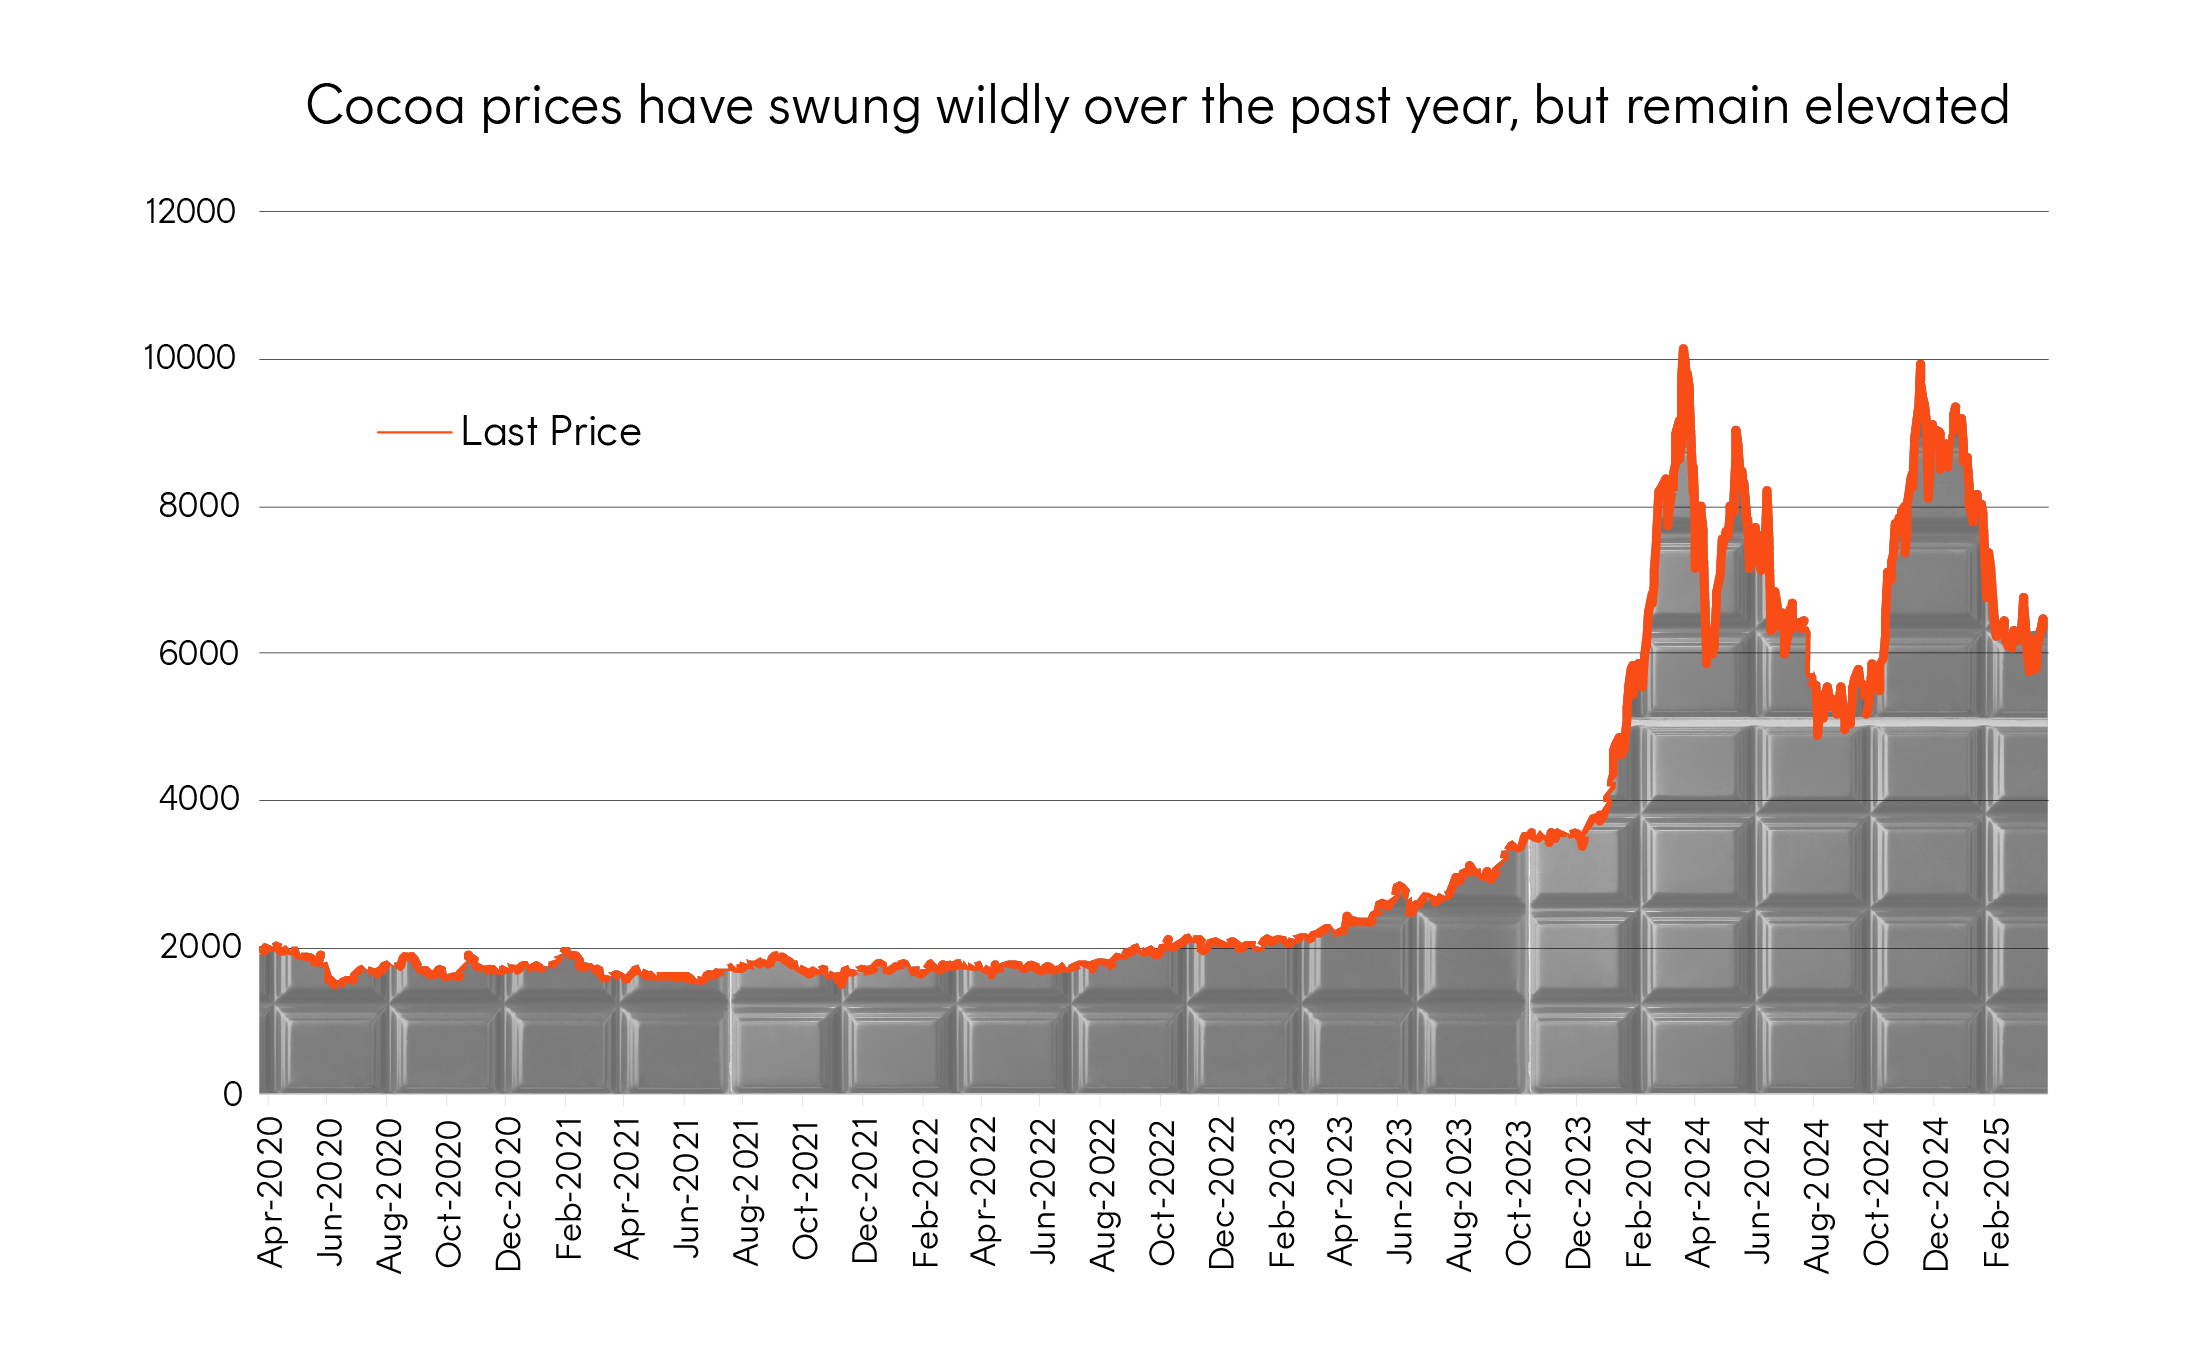
Source: Bloomberg. Period from 27 April 2020 to 23 April 2025.
That’s all for this edition of Charts of the Month. For more investment and market insights, visit the Betashares Insights page here.