


This article was written by Fran Beyers, Head of Capital Markets at Cliffwater LLC (Cliffwater), and has been republished with Cliffwater’s permission. Cliffwater are the inaugural partners of Betashares Private Capital and manage the underlying fund into which the BPC Cliffwater Private Credit Fund (Fund) invests. Betashares has not verified and does not warrant the accuracy or completeness of the information. The views expressed are Cliffwater’s and do not necessarily represent the views of Betashares. The article discusses US market, fund and tax concepts that may not apply to Australian investors or funds. CDLI data and index returns do not represent the performance of the Fund or its underlying fund.
The Fund is only available to wholesale investors, and other investors with a financial adviser using an investment platform. Must not be distributed or made available to retail clients. It is suited to investors comfortable with the risks associated with private credit, including exposure to an asset class that is inherently illiquid and limited ability for investors to withdraw their investment. Generally, Betashares will process redemption requests from the Fund on a quarterly basis, in line with the quarterly repurchase offer of the Underlying Fund. Note that an investor’s ability to redeem will be subject to various factors including available liquidity and the Fund’s ability to withdraw from the Underlying Fund. In certain circumstances, it is possible that redemptions will not be able to be paid upon request (either in full or partially).
Past performance is not indicative of the future performance of any index or fund. This article may include opinions.
A growing number of industry participants (credit agencies, valuation firms, asset managers, and others) now publish private credit default rates. Recently, these reported numbers have ranged between 1% and 20%, creating more confusion than understanding. Differences among these reported numbers reside in their various definitions of default, not fundamentals.
Avoiding this confusion, Cliffwater Direct Lending Index (CDLI) reports the two things that matter most to investors. The first is actual (1) realized losses from loan impairments, whatever form of default, restructuring, and recovery they take. These realized losses reduce the cost value of the loan and ultimate repayment of principal. And for many investors realized losses are a taxable event. Realized losses in private credit have been well below their 1% historical average over the last few years, reflecting a resilient economy and solid loan underwriting. CDLI also reports (2) unrealized loan losses, an assessment by independent valuation firms and loan managers of potential future realized losses. These unrealized losses capture a professional evaluation of the many indicators of future realized loss that industry participants cite, such as PIK, non-accrual, amendments, etc. Unrealized losses do not impact cost value and have no tax consequence. They are instead well-informed expectations of future realized losses. Unlike realized losses, unrealized losses have increased in recent quarters from concerns about AI’s impact on future loans to software companies. These unrealized software loan losses have surged to nearly 3% over the past six months, though no meaningful realized losses or defaults have yet occurred. With software being the highest sector weight within the CDLI universe, these markdowns were a big contributor to overall private credit unrealized losses of 1.4% over the past six months, suggesting future realized losses ahead.
Why Is There So Much Dispersion in Default Headlines?
Private credit defaults are back in the headlines, and coverage is accelerating faster than investors’ ability to make sense of it. One provider cites a default rate near 1%; another, covering the same market in the same quarter, cites nearly 20% (See Appendix). That is not a typo, and it does not mean one firm is right and the other wrong. “Default” is measured, not observed – and how it is measured changes the answer entirely.
Three forces drive the dispersion:
- Coverage: Private credit is fragmented and disclosures (outside of 40-act vehicles) can be challenging for third-party research providers. Often the size of the dataset, both in the numerator and denominator, is limited to just a subset of the market, making comparisons difficult.
- Weighting: A “dollar-weighted” rate reflects the true principal risk an actual portfolio carries. This is particularly true as direct lenders will often take smaller holds on riskier deals and bigger holds on higher conviction deals. Meanwhile an “issuer-weighted” rate simply tallies the count of troubled names, which some providers rely on when their dataset is too thin, to weight meaningfully by size. In issuer-weighted default stats, one part of the market can drive outsized stress ratios but that might not be reflective of an investor’s portfolio or the market. The media often fails to divulge the size of the dataset when quoting default statistics.
- Definition matters most: What one provider calls a “default,” another calls an “amendment” or a “material modification.” Rating agencies often maintain consistency of default definitions between private credit and the liquid loan market, despite workout situations and payment-in-kind (PIK) flexibility being different.
What Is a Default?
A default, properly defined, is an uncured breach of the credit agreement – the borrower failed to do what it contractually promised. Some situations are unambiguous: placing a loan on non-accrual status, a missed principal or interest payment, failure to refinance principal at maturity, or filing for bankruptcy. Others are materially less severe and have minimal impact on returns–a late financial report, a covenant reset, a routine amend-and-extend–and should never be conflated with the former.
The real ambiguity sits between these poles, in what the market calls a “selective default” or a “material modification.” Basically, genuine stress that is resolved before a payment is missed.
Consider a loan at Secured Overnight Financing Rate (SOFR) (S)+600 basis points (bps) that hits liquidity pressure. The lender group cuts the cash burden to S+250 and adds a PIK component of 500bps to account for the increased credit risk for deferring payments. The amendment may extend maturity a year, charge an amendment fee, and reset covenants. A CLO equity holder feels the dividend impact from the reduced cash rate immediately, as residual cashflow drops following the PIK conversion. As such, a ratings agency will flag this as a default.
Meanwhile, a business development company (BDC) or interval fund may or may not flag this as a non-accrual loan depending on if full repayment is still expected. Contrary to a CLO equity investor, the private credit lender will not experience the same reduction to their dividend. Taxable income for a registered investment company (RIC) generally includes PIK, so reported net investment income can hold up even as cash interest falls. Despite this, the economic hit still arrives through the unrealized markdown: third-party valuation firms will re-underwrite an “amended PIK” loan. Same credit event, two different investor experiences, and a data point most research providers would count differently.
Exhibit 1: Credit agreement breaches by severity and market convention around defaults
| Situation by Severity (low to high) | Would Rating Agencies Count as Default? | Would Direct Lenders count as a default / non-accrual? |
|---|---|---|
| Missing financial reports | No | No |
| Amend and extend (maturity extension) for normal business reasons | No | No |
| PIK toggle (permitted under original doc) | No | No |
| Covenant reset | Potentially yes | No |
| Covenant waiver due to underperformance | Yes | No |
| Material covenant relief + lender compensation | Yes | No |
| New PIK because borrower needs liquidity support | Yes | Potentially/Situation Specific |
| Maturity extension because borrower cannot refinance | Yes | Potentially/Situation Specific |
| Interest payment missed beyond grace period | Yes | Yes |
| Principal haircut / debt forgiveness / structural subordination | Yes | Yes |
| Debt for equity exchange caused by distress | Yes | Yes |
| Principal / maturity payment misses | Yes | Yes |
| Lender takes control / foreclosure | Yes | Yes |
| Bankruptcy filing | Yes | Yes |
Non-Accrual Debate
The distinction between accrual and non-accrual status is somewhat ambiguous as the private credit market affords PIK flexibility unavailable in the liquid loan market.
Non-accrual generally means a loan for which the lender has stopped recognizing contractual interest income on an accrual basis because collection of that interest and principal is no longer considered sufficiently probable. The loan can later be returned to accrual status if the borrower becomes current and there is sufficient evidence that contractual principal and interest will be collected.
Consider, for example, an industrial borrower operating in a rising-rate environment that encounters a short-term working capital shortfall after committing meaningful capital expenditure toward a prospective long-term customer contract. A supply chain disruption delaying delivery of a critical input prompts the borrower to approach its bank group for a short-term PIK accommodation spanning three quarters until the component arrives and the contract can be fulfilled. The circumstances support the view that the lender will likely recover all principal and interest once the underlying supply chain constraint is resolved and, thus, would not warrant non-accrual classification — the bank group is confronting a timing issue rather than an impairment of repayment capacity.
By contrast, consider a highly levered software credit under sustained pressure from a large competitor undercutting it on price, a dynamic that constitutes genuine financial distress. The competitor’s aggressive positioning is driving a material decline in the borrower’s EBITDA, as significant churn erodes its top customer base. Such a borrower is likely to require extended liquidity relief–typically exceeding twelve to eighteen months–and the lending group would probably move the loan to non-accrual status given that projected cash flows and enterprise value may prove insufficient to support repayment. In this scenario, lenders would need to pursue a considerably more assertive resolution strategy to recover principal.
Rather than fold every stress event into one binary default metric, investors should review several–watchlists, amended PIK activity, non-accruals, and valuation trends–so investors can see what is driving a headline. That is the purpose of the CDLI Credit Health Barometers.
Exhibit 2: CDLI Credit Health Barometers provide a glimpse into borrower health across the market
| CDLI Credit Health Barometer | 3Q24 | 4Q24 | 1Q25 | 2Q25 | 3Q25 | 4Q25 | 1Q26 | 2Q26 |
|---|---|---|---|---|---|---|---|---|
| Non-Accruals % of Cost | 1.33% | 1.33% | 1.26% | 1.20% | 1.35% | 1.27% | 1.85% | 1.73% |
| PIK Income % of Inv. Income | 7.03% | 8.13% | 6.92% | 7.16% | 7.30% | 7.31% | 6.83% | 6.92% |
| % of Loans Marked < 90 (cost) | 5.17% | 5.52% | 6.65% | 5.72% | 5.92% | 6.12% | 7.25% | 7.45% |
| % Portfolios on Watchlist (FV) | 9.55% | 8.87% | 7.19% | 7.41% | 7.38% | 7.51% | 8.46% | 8.84% |
| Trailing 4Q Unrealized Losses % | +0.22% | +0.15% | -0.40% | -0.17% | -0.20% | -0.38% | -1.22% | -1.59% |
| Trailing 4Q Realized Losses % | -0.66% | -0.69% | -0.63% | -0.75% | -0.61% | -0.64% | -0.58% | -0.47% |
Amended PIK: Solution or Precursor to Default?
The CDLI is an asset-weighted index tracking performance across 10,000 issuers representing more than $550 billion in assets. CDLI tracks non-accrual loans each quarter as a percentage of total investment outstandings through non-accrual rate, a metric designed to give investors insight into what portion of the asset class is failing to accrue interest income to the investor’s benefit in any given quarter.
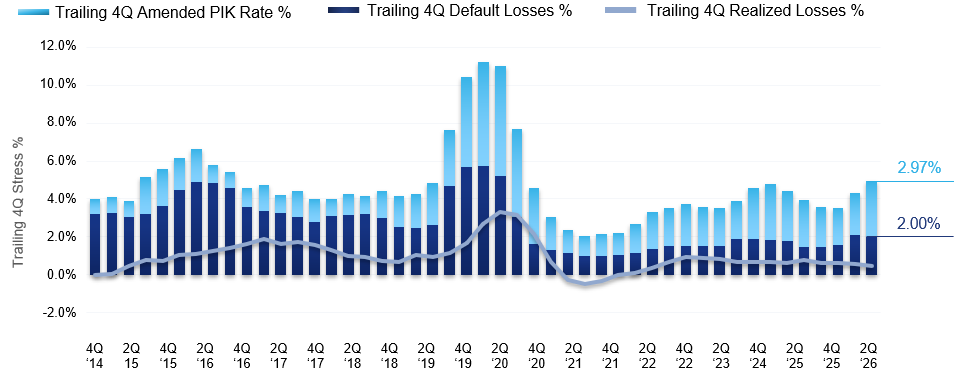
The CDLI also tracks a trailing four-quarter default rate, calculated by summing the dollar amount of loans newly placed on non-accrual status over the trailing period. As of 2Q26, the trailing four-quarter default rate stood at 2.00%.
It is true that private credit exhibits a fair amount of “collaborative default” activity, in which sponsors and lenders work together to improve the odds of a full recovery for all parties rather than simply accelerating the loan and locking in a poor outcome.
Analyzing amended PIK activity offers the market a clearer window into these situations. The CDLI’s amended PIK statistics capture accruing loans at the point they convert from all-cash-pay to partial PIK, while also exhibiting a fair value-to-par mark below 96.
Adding the trailing four-quarter amended PIK rate of 2.96% at the end of 2Q26 to the 2.00% default rate brings the broader stress rate to roughly 5%, consistent with the more expansive definitions employed by the ratings agencies in media headlines.
Exhibit 3: CDLI trailing 4Q default rate + amended PIK rate reaches around 5.0% in 2Q26
Trailing 4Q Default + Amended PIK %
While amended PIK can be a good forward indicator of future defaults, the additional liquidity runway also can result in positive recovery outcomes.
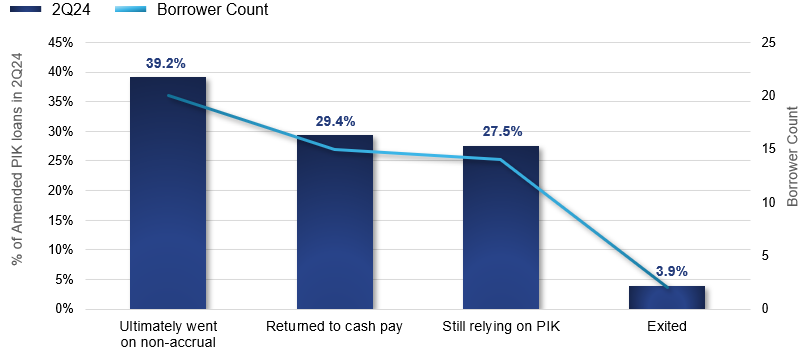
As an example, the CDLI isolated and examined a pool of loans that flipped to amended PIK in 2Q24 and followed the result of recovery over the subsequent 8 quarters across the 50 borrowers. The data shows that roughly 40% of the amended PIK loans did eventually go on non-accrual status — however, 30% of the borrowers recovered and went back to cash pay. After eight quarters, roughly one-quarter of the loans were still relying on PIK and had not reached resolution, and this has been particularly true in this cycle due to more elevated base rates.
Exhibit 4: How often does amended PIK default, and how often does it recover within CDLI?
Example of Amended PIK Outcomes Eight Quarters Later
In exchange for converting the loan from cash pay to partial PIK, the sponsor often injects additional equity into the borrower’s business to provide more runway and flexibility to get through a rough patch. Lack of sponsor support is indicative of increased concern and would be a factor into the bank group’s decision on whether to be more aggressive in working out the loan and/or placing the loan on non-accrual status.
The Bottom Line: Returns through the Cycle
A well-built default rate is a leading indicator— however, it only flags stress, not outcome. It cannot say what is ultimately recovered or what a credit event costs a portfolio over time. The more durable signal is the path of realized and unrealized losses across a full cycle.
Direct lending’s biggest risk to returns tends to be broad macro-economic dislocations. Across nearly twenty years, the pattern holds: unrealized marks widen as stress builds, narrow as credits are worked out or repaid and as the cycle recovers, and realized losses typically land well below what the unrealized swings alone might suggest.
Exhibit 5: Unrealized losses are a great barometer to see where we are in the credit cycle
CDLI Unrealized Losses Provide 10,000 Foot View on Macro Dislocations within Private Credit
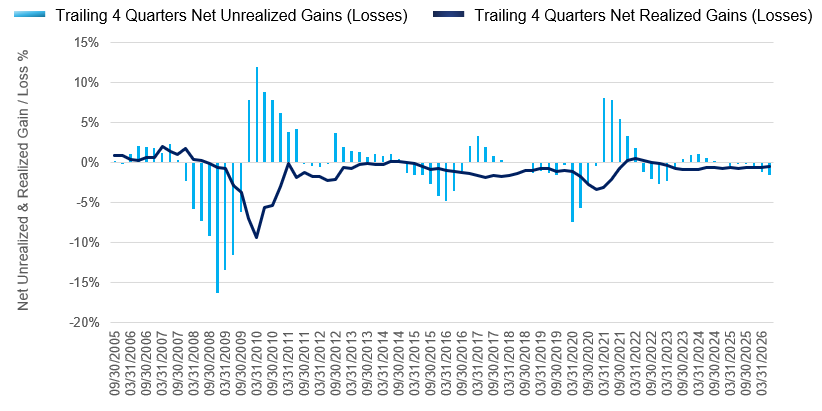
At the end of 2Q26, trailing 4Q unrealized losses reached -1.59%, somewhat elevated compared to 2024/2025 levels but nowhere near the levels we typically saw when the asset class was experiencing broad stress. In fact, software markdowns related to AI disruption risk were the primary driver of unrealized loss so far in 2026 to returns, accounting for nearly two-thirds of the markdowns witnessed in 1Q26, not broad macro-economic stress. This becomes even more apparent when looking at trailing 4Q realized losses which were only 47bps through 2Q26, the lowest level tracked in thirteen quarters.
Exhibit 6: Swings in investors’ returns are driven by Net Realized + Unrealized Losses combined
CDLI Trailing 4Q Returns vs. Net Realized/Unrealized Losses
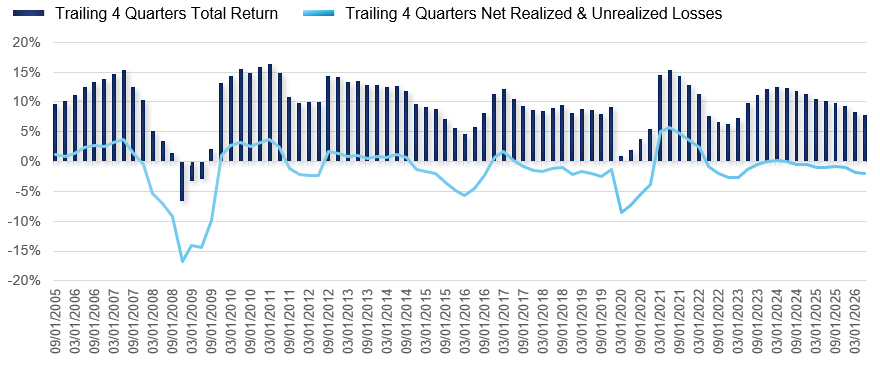
Monitoring the various barometers of credit stress remains valuable, but it is unrealized markdowns, and the realized losses that follow, that ultimately impact returns. That is exactly why these figures are the ones investors can lean on when default statistics diverge by definition or methodology. A realized loss is not a matter of interpretation: it cannot be reclassified, redefined, or counted differently from one provider to the next. Realized losses are the king metric, and they cannot be manipulated.
Appendix: Coverage, weighting and definition – not divergent fundamentals – explain the differences in metrics across data providers
| Provider | Default Rate | Coverage | What Counts as Default | Period |
|---|---|---|---|---|
| Fitch | 6.3% | More than 1,300 credit opinions for pooled assets, and more than 350 private ratings | Uncured payment default or distressed debt exchange | Trailing 12 months to August 2026 |
| Houlihan Lokey | 0.8% by outstanding principal; 2.5% by count | 80,000 loan valuations since 2017 across thousands of borrowers globally | Technical defaults as well as payment defaults | Q2 2026 |
| KBRA | 3.3% by count; 2.4% by debt | 2,785 global borrowers with more than $1.2 trillion of direct lending debt | Payment default, imminent default, or intervention that prevents payment default | End of Q2 2026 |
| Lincoln | 1.5% | ~450 European loans, measured by weighted debt outstanding | Covenant default or payment holiday | Q2 2026 |
| Pimco | 19% | BDC borrowers reported by PitchBook with at least $100 million of assets | Payment default, non-accrual, cash-to-PIK conversion, material maturity extension or debt-for-equity swap | Data as of March 31, 2026 |
| Proskauer | 2.51% | 716 senior-secured and unitranche loans representing $195.6 billion in original principal | Payment default, distressed restructuring, bankruptcy, covenant default or certain other material defaults | Q2 2026 |
| S&P | 0.84% conventional default rate; 3.93% including selective defaults | About 3,900 unrated borrowers with loans held by middle-market CLOs | Traditional default; broader measure also includes selective defaults and distressed restructurings | Q2 2026 |
Note: This chart is intended to show how metrics differ in general terms. Definitions and sample sizes may be more detailed than they are shown to be here. 1 Fitch says a default debt exchange must meet two requirements: The lender accepts materially reduced terms (PIK doesn’t count if documents already allowed such an option), and Fitch must believe that without the changes, the issuer would have likely defaulted on a payment or entered bankruptcy or similar proceedings. 2 PIK optionality present at origination is excluded. 3 For S&P, a traditional default includes a bankruptcy filing or a general payment default across the capital structure; a selective default is one where only one lender class is impacted due to a breach in the terms of payment.
Source: Bloomberg, “Private Credit Defaults are 1%, 6%, or 19%, Depending on who you ask,” September 17, 2026.