The business model with many return drivers | Betashares
About
Loading
This content is for financial adviser use only.
By clicking on 'Financial professional', you certify that you are an Australian financial services licensee or authorised representative, and are authorised to provide personal advice to retail clients in relation to managed investment schemes.
Home
keyboard_arrow_down
chevron_right
Insights
keyboard_arrow_down
chevron_right
The business model with many return drivers
keyboard_arrow_down

The business model with many return drivers

7 min read • 11 Nov 2026

This information is for the use of financial advisers and other wholesale clients only. It must not be distributed to retail clients.

Key points

01
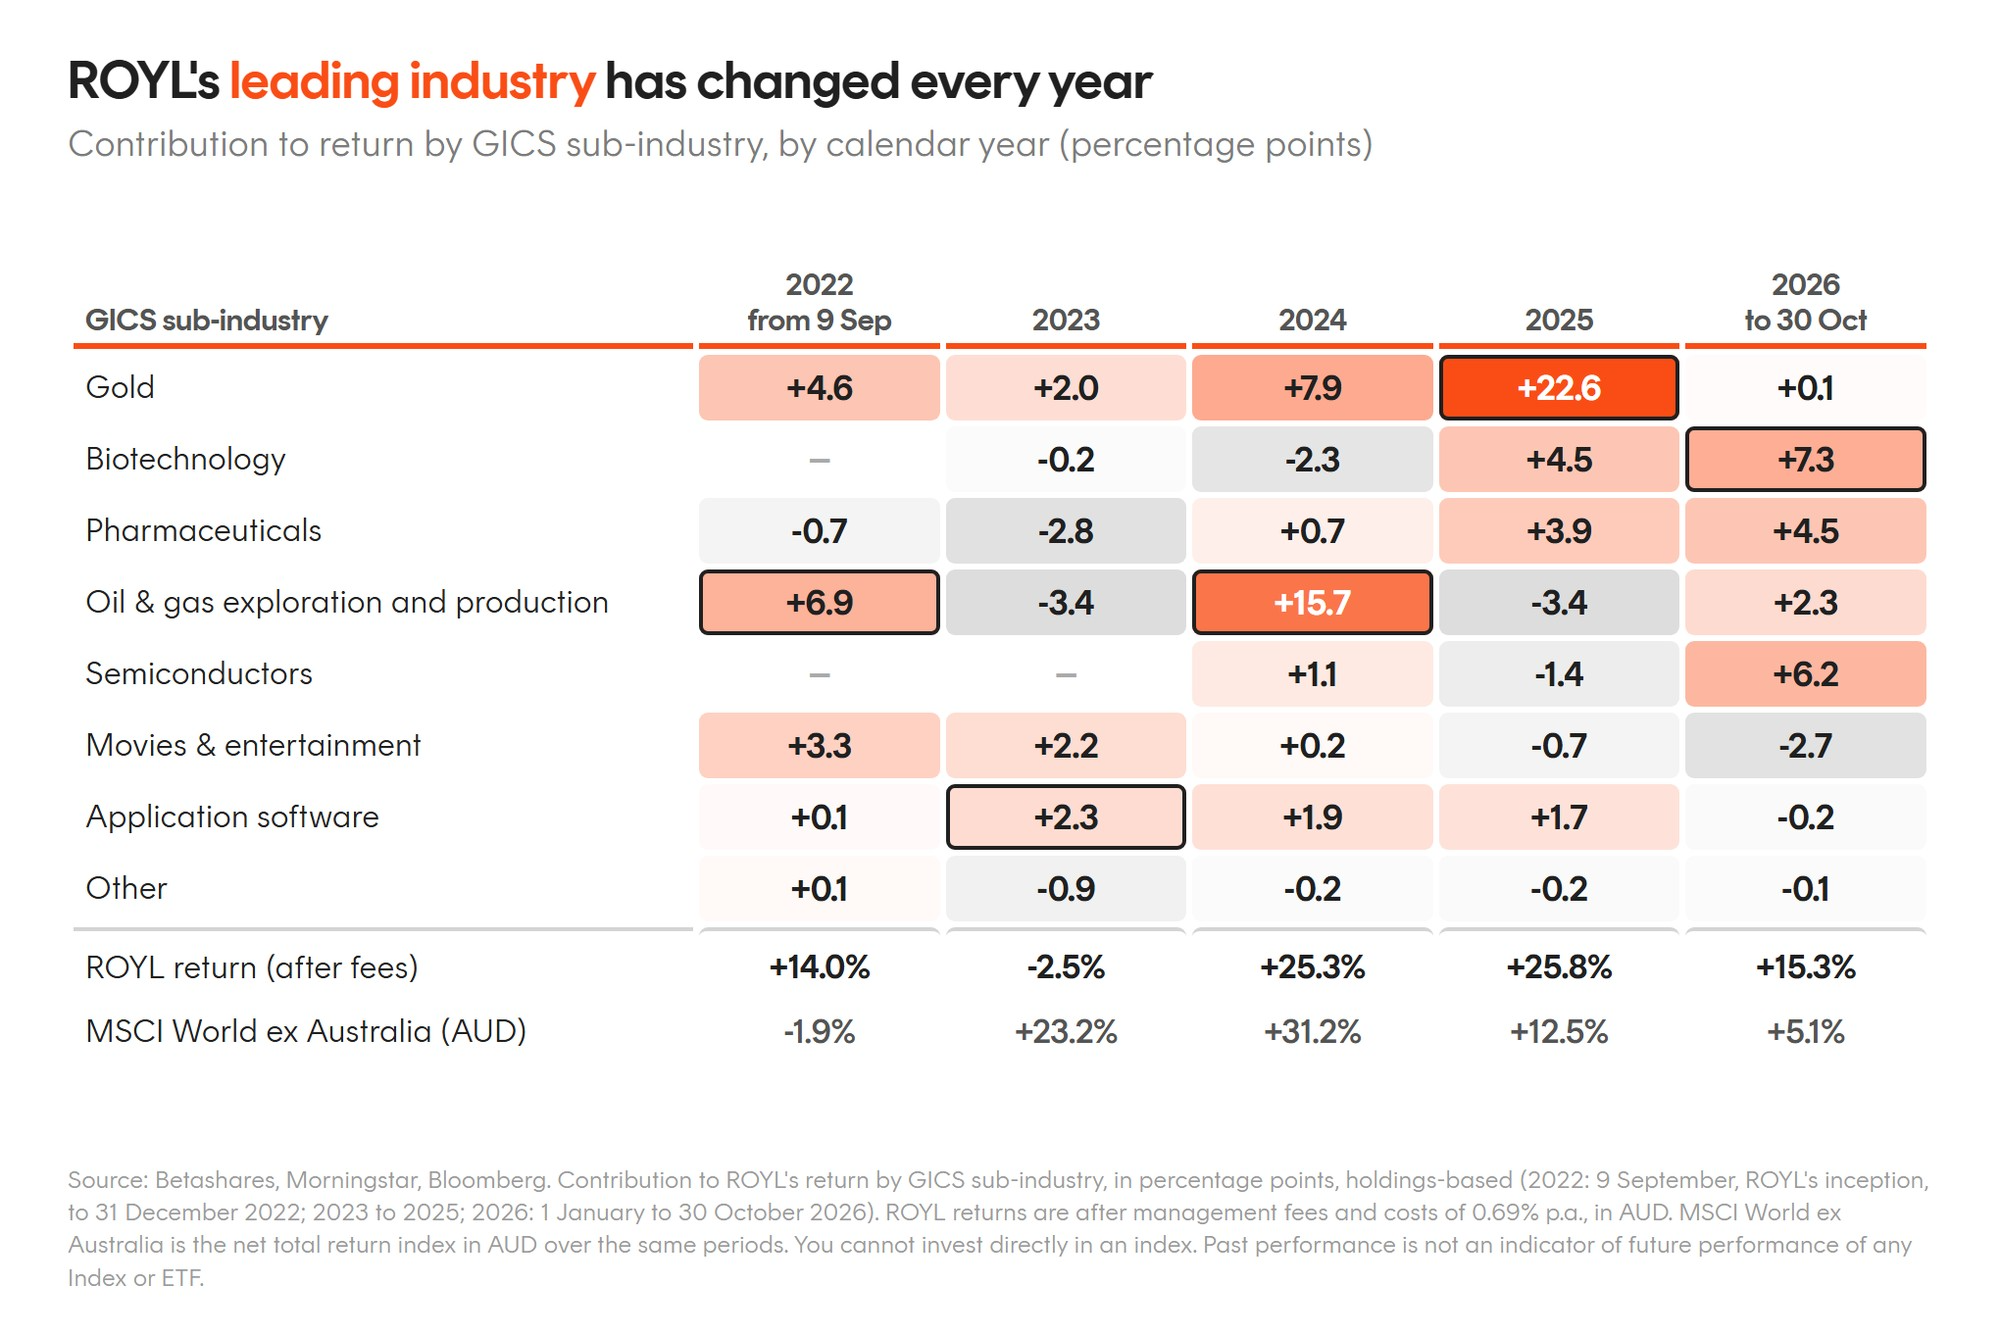
ROYL’s leading return driver has changed every year since its 2022 launch. Oil and gas royalties led in 2022 and 2024, music, technology licensing and gold in 2023, gold again in 2025, and drug and chip-design royalties in 2026.
02
The 4 November rebalance left ROYL less concentrated in its largest holdings. ARM Holdings falls to 6.3%, the top 10’s combined weight drops from 76.2% to 72.7%, and holdings rise from 46 to 49.
03
Royalty payments are often linked to prices, and ROYL’s index has moved less in step with mainstream assets, with a correlation of 0.44 with global shares since November 2018. ROYL also pays monthly, with a 12-month distribution yield of 5.4% at 30 October 2026.

In a market seeking genuine diversification, global royalty companies have stood out.

The ROYL Global Royalties ETF has returned 15.6% over the past year and 18.5% a year since inception in September 2022, ahead of the MSCI World ex Australia Index (AUD), which returned 4.3% and 16.4% a year over the same periods.5

With companies selected on their business model rather than the industry they operate in, ROYL’s underlying holdings can offer investors differentiated return drivers through the market cycle.

Following its rebalance on 4 November, ROYL’s portfolio is less concentrated in its largest holdings, and it now holds 49 companies, up from 46.

Return leadership across industries

A royalty company owns a share of the revenue from an asset that someone else manages. The operator carries the cost of building, running and expanding the asset, while the royalty owner is paid from the top line. The result is often a capital-light business with high margins.

ROYL’s index selects companies with that business model differentiating itself from indices that select holdings based on a sector or companies related to a shared thematic. The portfolio spans gold streamers, owners of drug royalties, holders of land and mineral rights, music catalogues and chip-design licensors. These businesses share a model but respond to very different return drivers.

Since inception different return drivers have driven ROYL’s performance. Oil and gas royalties led in late 2022, with energy prices elevated after Russia’s invasion of Ukraine. In 2023, as oil prices eased and US rates rose, music rights, technology licensing and gold led. Oil and gas led again in 2024 on record US production, and gold in 2025 on record prices and falling rates. In 2026, drug and chip-design royalties have led, on trial results, growing sales and AI demand.

As the chart below shows, this return leadership rotation has given ROYL returns that move differently from the broader market. ROYL outperformed MSCI World ex Australia in the three periods when global shares were weakest and lagged the two years they rose most strongly (most notably in 2023) – the pattern of a portfolio diversifier.
Royalties, rebalanced

ROYL’s index rebalances twice a year, on the first Wednesday of May and November. At each rebalance companies are capped at a maximum 10% weight.

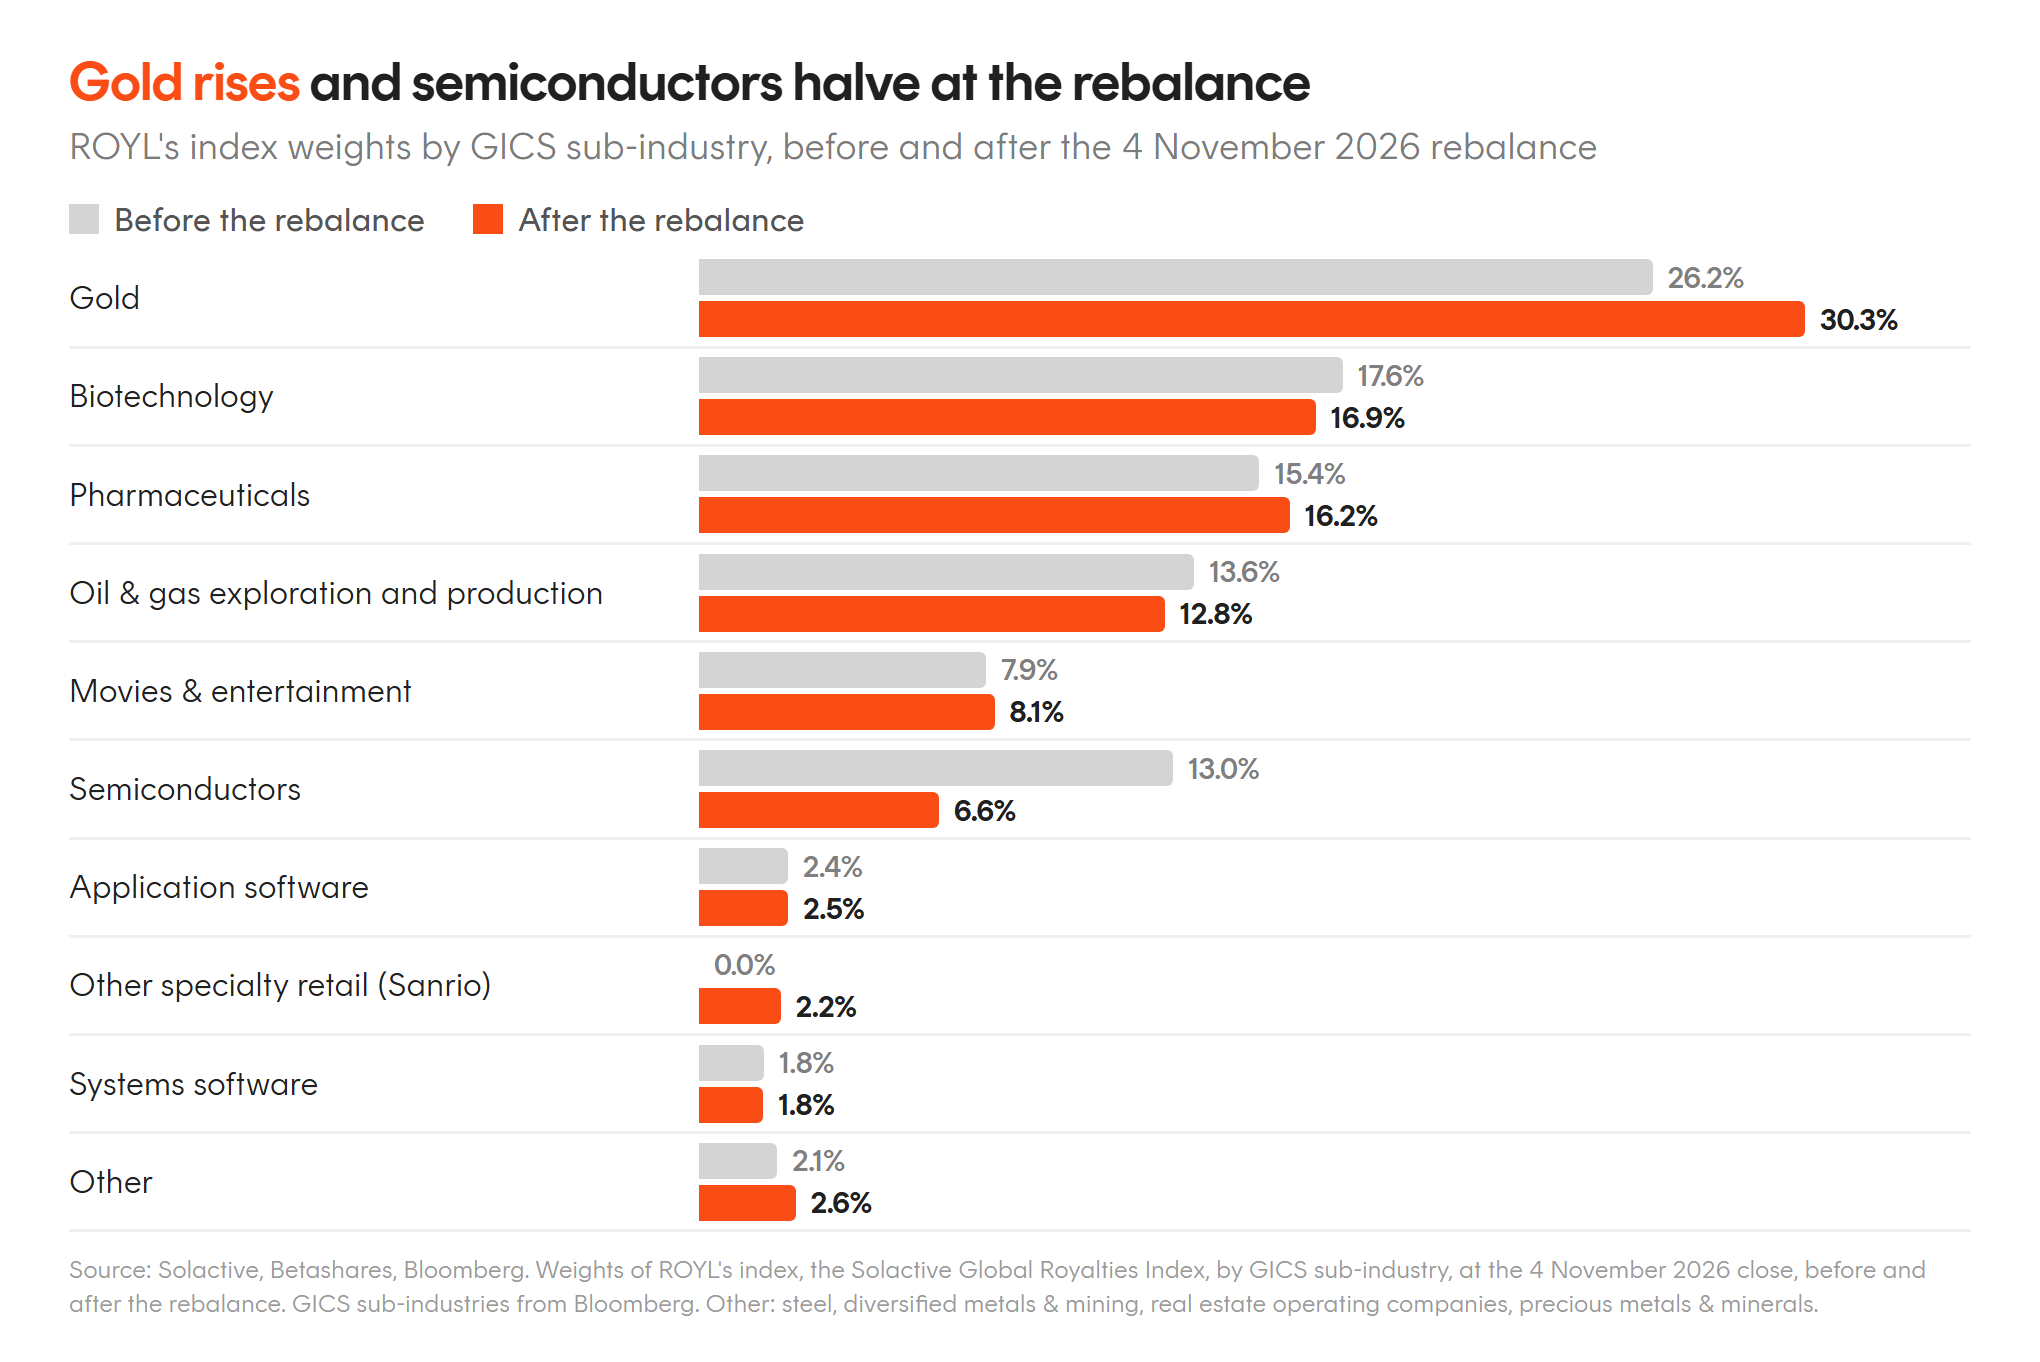
After May’s rebalance this year ARM Holdings, a British semiconductor company that operates primarily as an IP licensor, earnings royalties rather than manufacturing the physical chips, had grown well above 10% after a strong run in its shares. It was set back to 10% at the 7 October selection day for the November rebalance, and its share price has since fallen, so ROYL rebalance saw the position sold down with ARM entering the new portfolio at 6.3, representing ROYL’s seventh-largest holding.

Post rebalance the same ten companies make up the top 10, and their combined weight falls from 76.2% to 72.7%. Gold remains the largest sub-industry, while semiconductors are roughly halved, as ARM is trimmed. Importantly, ROYL’s index reflects a healthy mix of sub-industry exposure positioning it for various market environments in the period to come.
Investment implications

Royalty companies can bring particular benefits to a diversified portfolio. Because royalty payments are often linked to the prices of the output goods and services, while the operator bears the risk of rising input costs, royalty companies have tended to hold up when inflation runs high.

From December 2018 to September 2026, ROYL’s index returned, on average, 16.0% a year when US inflation was 4% or more, and 15.3% when US inflation was below 4%, just a 0.7 per cent difference. Over the same period the MSCI World ex Australia performed, on average, 4.5 percentage points worse under the higher inflationary periods (15.7% versus 11.2% per annum).6

ROYL’s differentiated returns drivers also shows up in its correlations with major asset classes. On monthly returns from November 2018 to October 2026, ROYL’s index had a correlation of 0.44 with global shares and 0.18 with Australian bonds, as shown in the correlation matrix below.
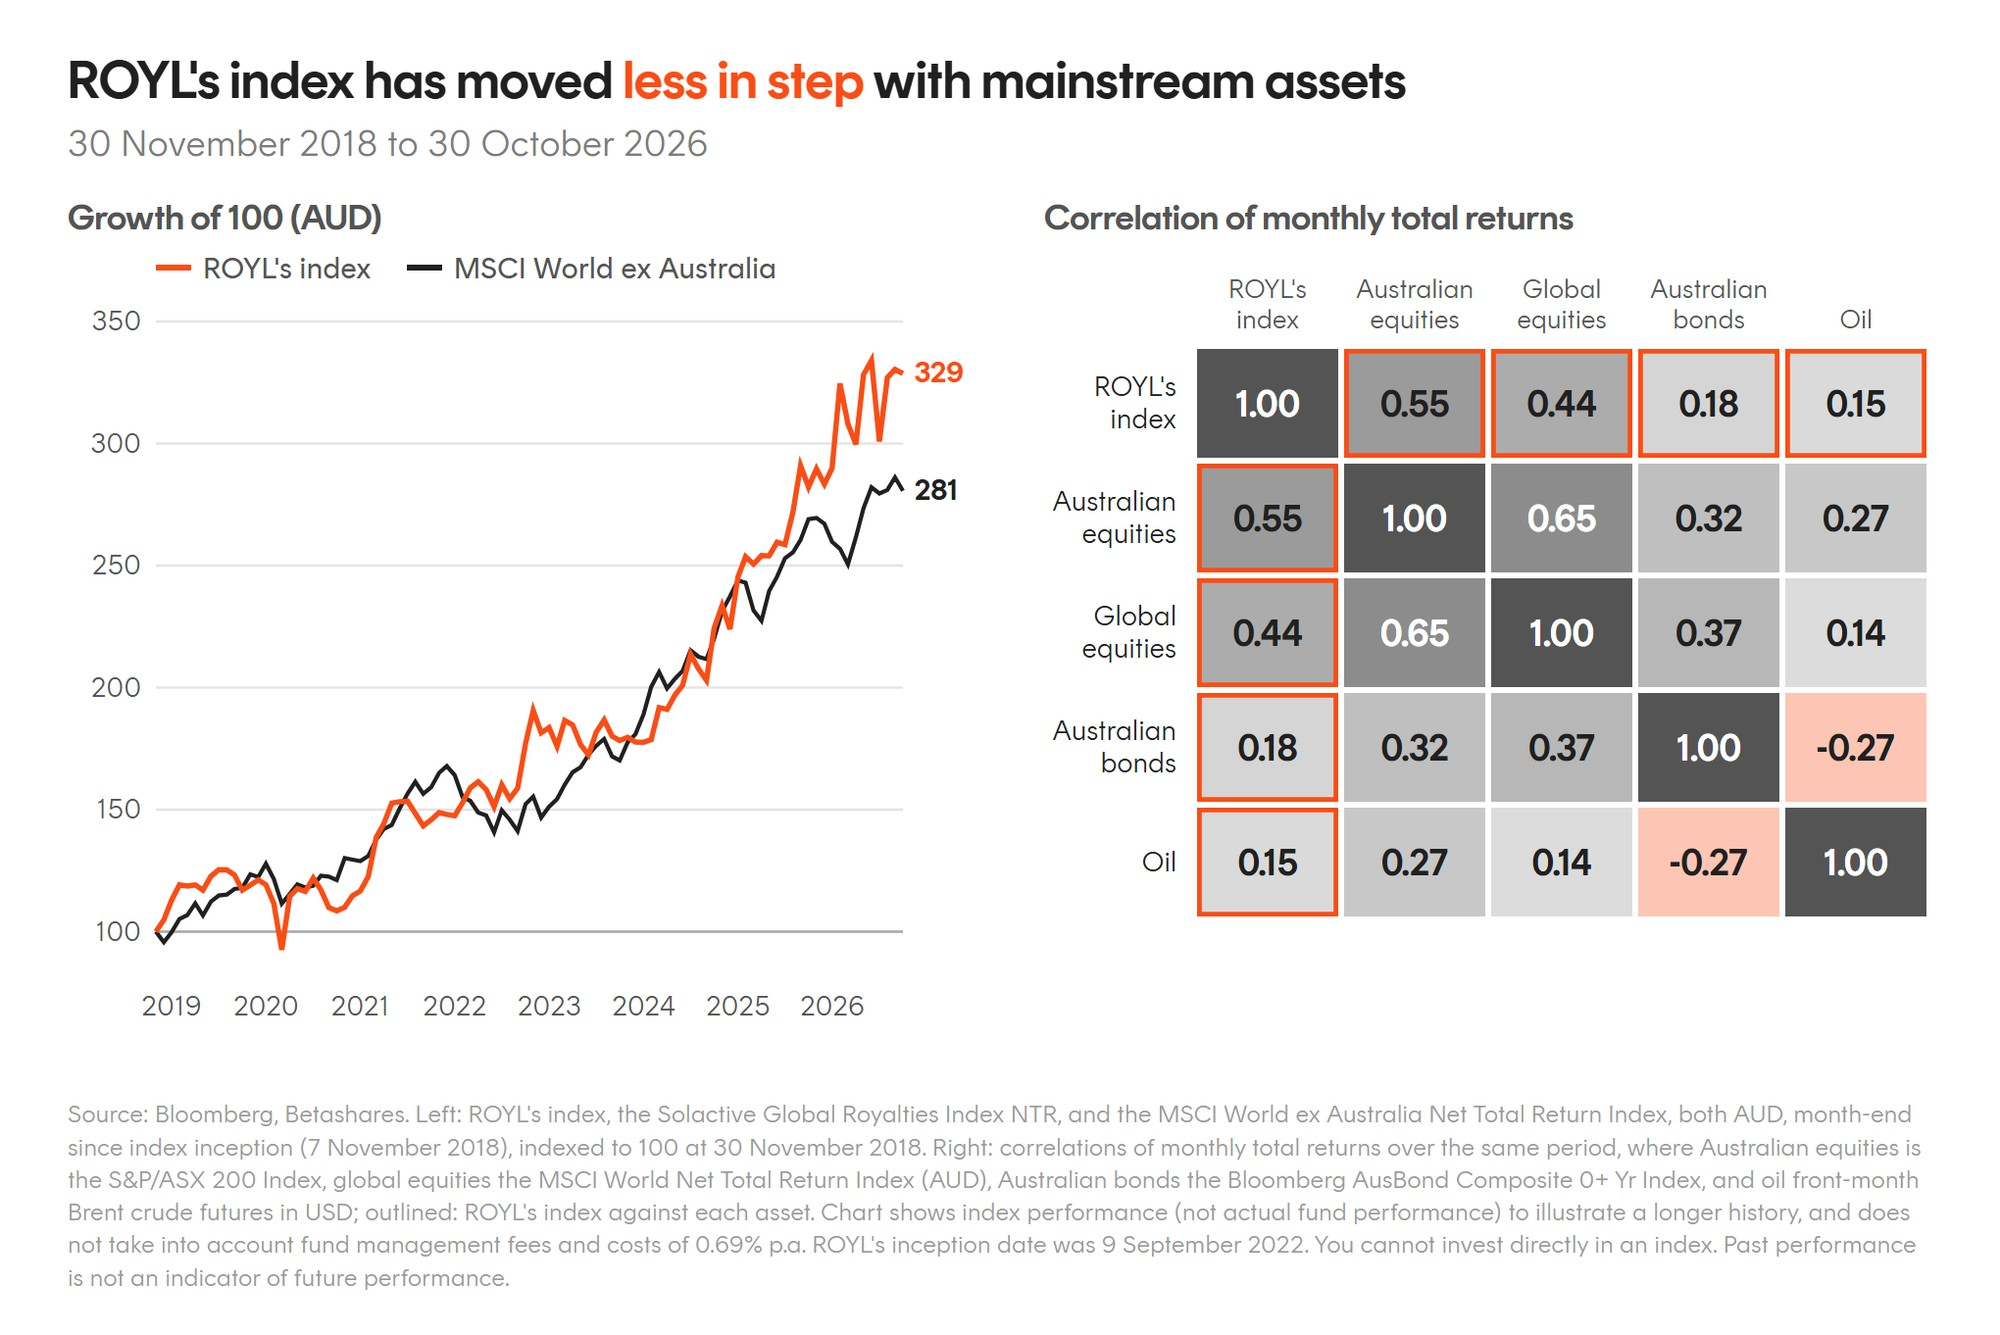
Finally, ROYL pays a monthly income, passing through the cash flow of its royalty companies and aiming to provide smoothed distributions. ROYL’s 12-month distribution yield was 5.4% at 30 October 2026.7

For investors looking for an alternative allocation with different return drivers from shares and bonds, ROYL offers access to a portfolio of global royalty companies in a single ASX trade.

For more information, visit the ROYL fund page or read the fund brochure here.

No assurance is given that any of the companies in a Fund’s portfolio will remain in the portfolio or will be profitable investments.

There are risks associated with an investment in ROYL, including market risk, international investment risk, sector risk, royalties related risks and concentration risk. Investment value can go up and down. An investment in the Fund should only be considered as a part of a broader portfolio, taking into account your particular circumstances, including your tolerance for risk. For more information on risks and other features of the Fund, please see the Product Disclosure Statement and Target Market Determination, both available on this website.

The information contained in this article is general information only and does not take into account any person’s financial objectives, situation or needs. Investors should consider the appropriateness of the information taking into account such factors and seek financial advice. This article is provided for information purposes only and is not a recommendation to make any investment or adopt any investment strategy.

1. Source: Betashares, Morningstar, Bloomberg. Contribution to ROYL’s return by GICS sub-industry, holdings-based and before fees: 9 September (ROYL’s inception) to 31 December 2022 calendar years 2023 to 2025 and 1 January to 30 October 2026. Past performance is not an indicator of future performance.

2. Source: Solactive. Weights of ROYL’s index, the Solactive Global Royalties Index, at the 4 November 2026 close, before and after the rebalance. There is no guarantee this holding will remain in ROYL or be a profitable investment.

3. Source: Bloomberg, Betashares. Correlation of monthly total returns, 30 November 2018 to 30 October 2026, between ROYL’s index, the Solactive Global Royalties Index NTR (AUD), and global shares, the MSCI World Net Total Return Index (AUD). You cannot invest directly in an index. Past performance is not an indicator of future performance.

4. Source: Betashares. 12-month distribution yield at 30 October 2026. Yield will vary and may be lower at time of investment. Past performance is not indicative of future performance.

5. Source: Bloomberg. Fund returns to 31 October 2026, after fees. ROYL’s inception date was 9 September 2022. MSCI World ex Australia Index (AUD), net total return. You cannot invest directly in an index. Past performance is not an indicator of future performance. ↑

6. Source: Bloomberg. Monthly total returns in AUD, December 2018 to September 2026. Inflation is headline US CPI, year on year: 4% or more from April 2021 to May 2023 and in May 2026. ROYL’s index is the Solactive Global Royalties Index less ROYL’s management costs (0.69% p.a.). You cannot invest directly in an index. Past performance is not an indicator of future performance. ↑

7. Source: Betashares. 12-month distribution yield at 30 October 2026. Yield will vary and may be lower at time of investment. The payment of distributions from the Fund is not guaranteed. Past performance is not indicative of future performance. ↑

Written by
Tom Wickenden works as an investment strategist in Betashares investment strategy and research team. Tom is responsible for supporting both the sales and marketing teams across Betashares’ wide range of funds including all major asset classes. In his day-today Tom writes investment insights, prepares and presents investment presentations, attends meetings as a specialist resource, and represents Betashares in external media, podcasts, conferences, and op-eds. Prior to Betashares Tom worked in an accounting firm in London specialising in the fields of audit and forensic accounting. Tom is a Chartered Financial Analyst and has a Bachelor of Commerce majoring in Economics and Accounting from the University of Sydney.
Loading
Feedback
close

This field is for validation purposes and should be left unchanged.
Please rate your experience with our website:*
Please let us know of any recommendations, difficulties or comments you have regarding our website

Feedback