



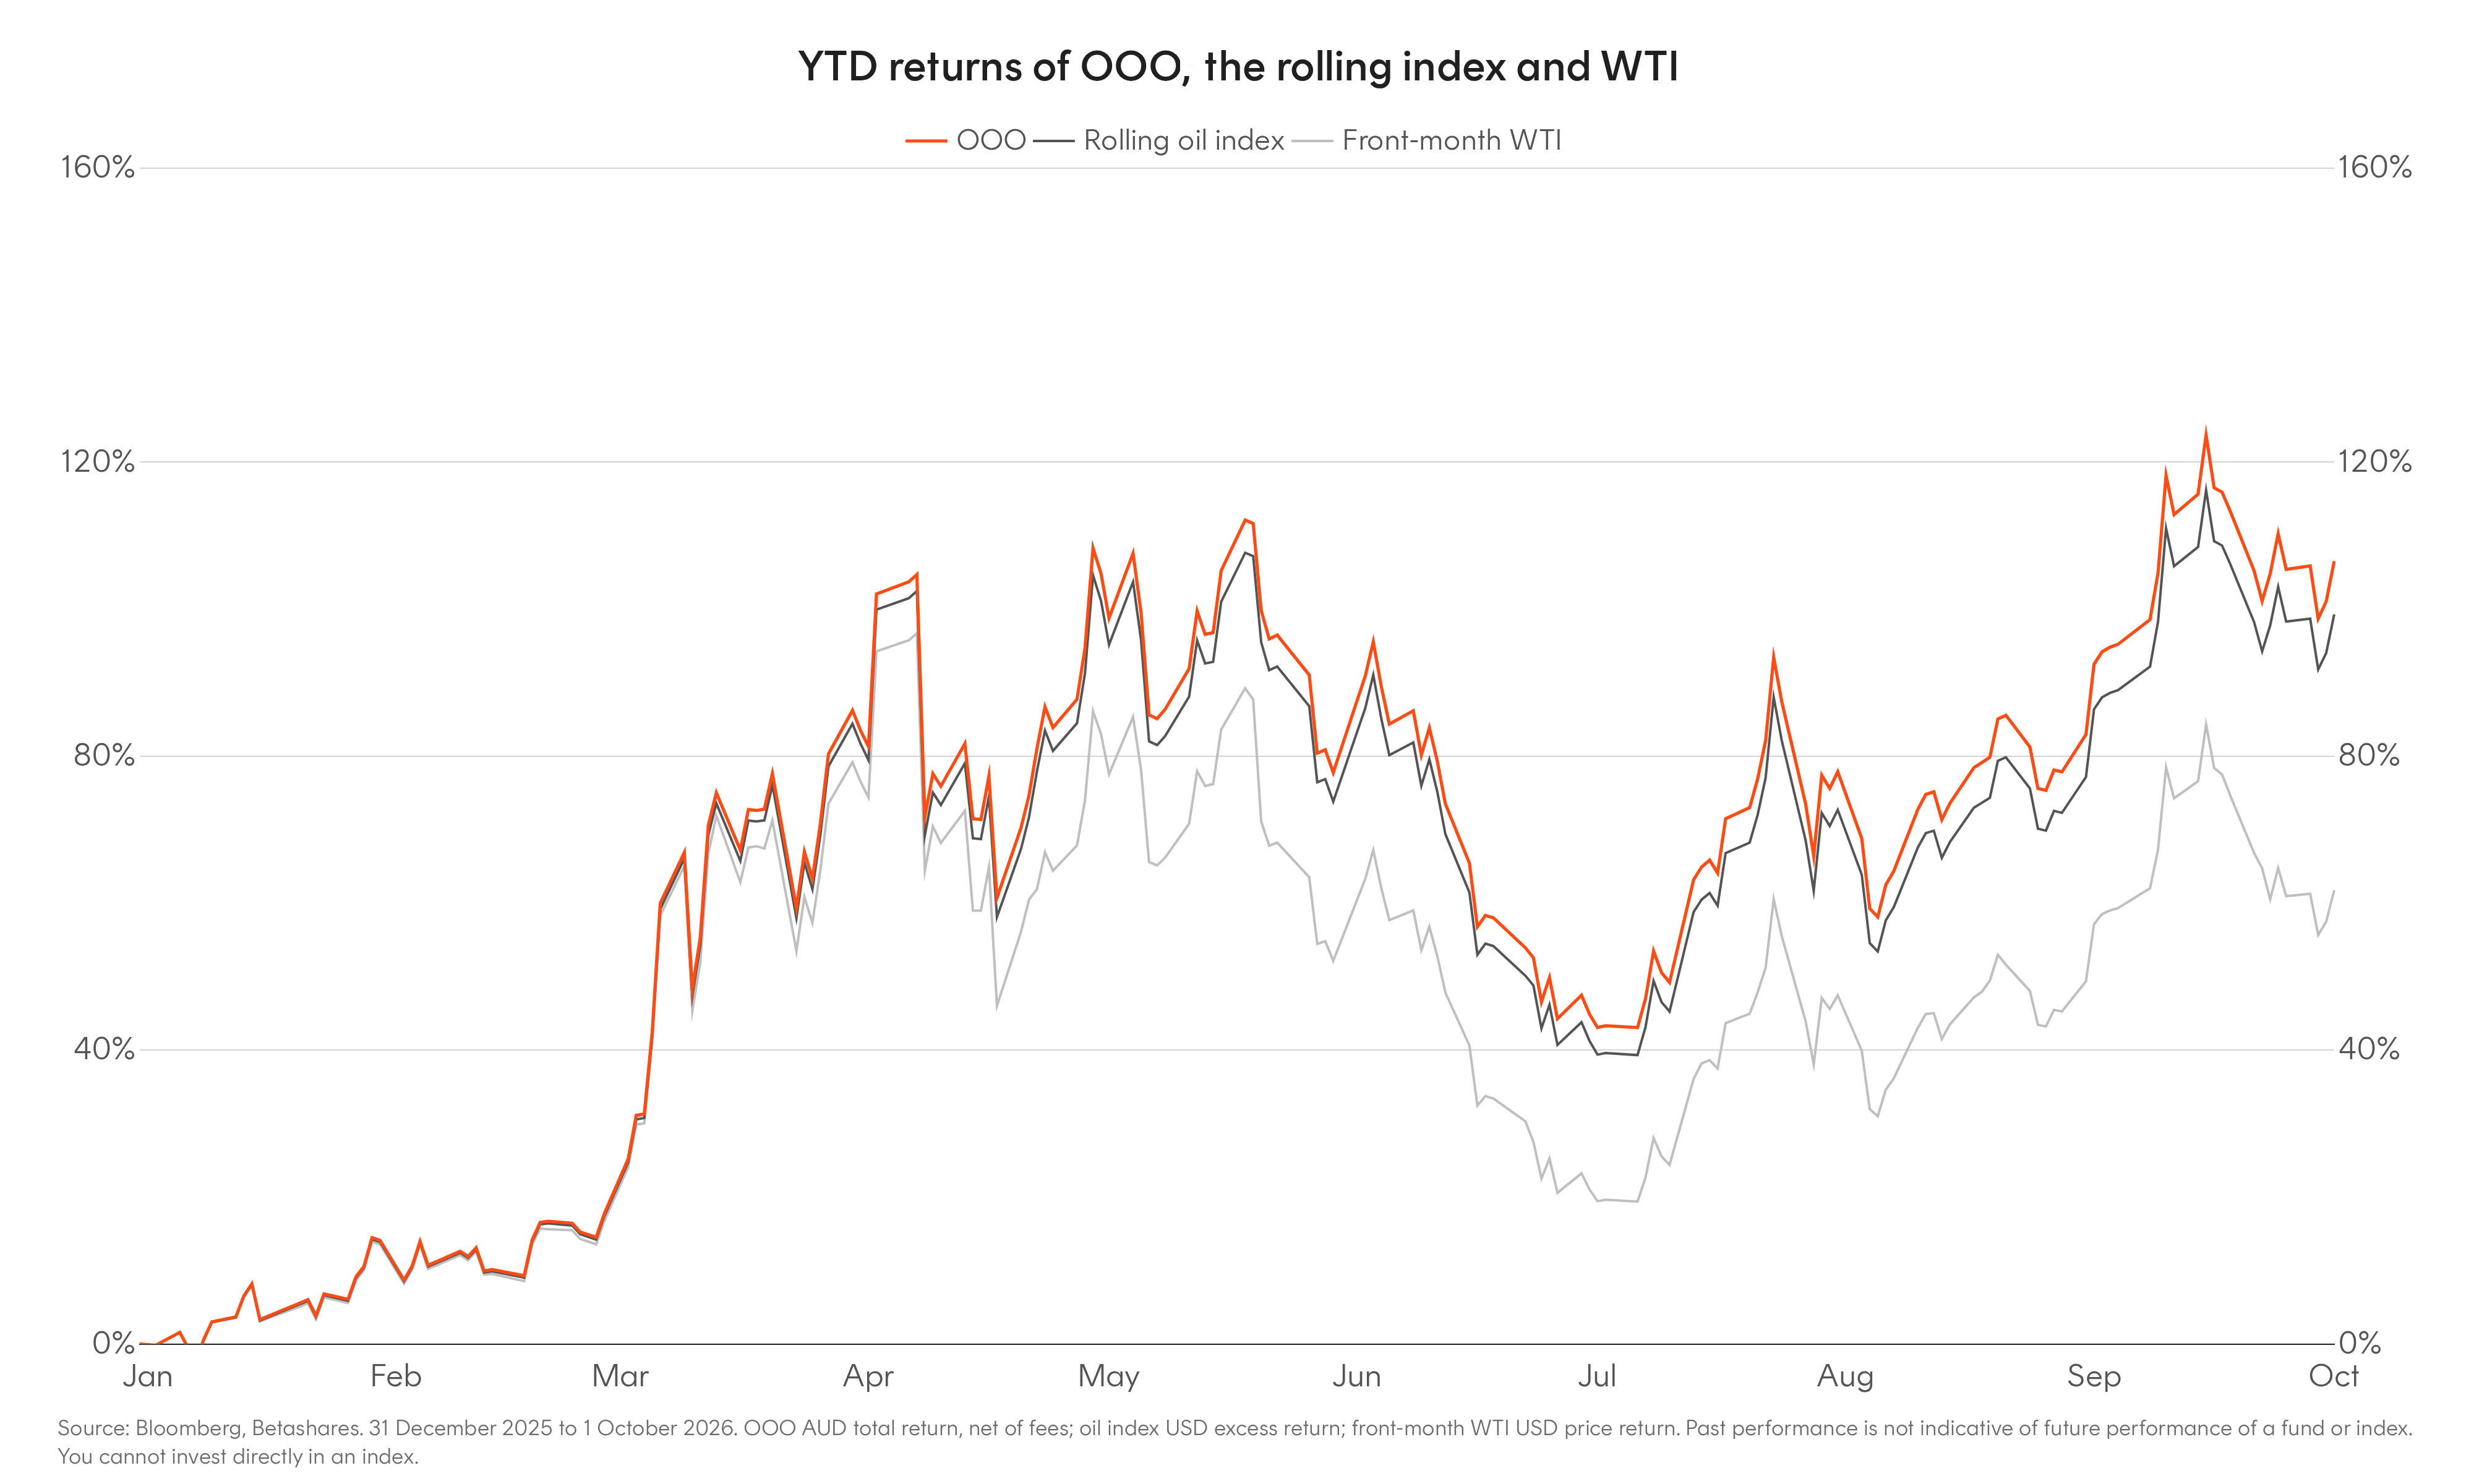
The OOO Crude Oil Index Currency Hedged Complex ETF has returned 106.53% in 2026 (to 1 October 2026), making it the highest-returning ASX-traded ETF so far this year (over the five years to 1 October 2026 it has returned 19.22% p.a., and it’s important to remember that past performance is not indicative of future performance).
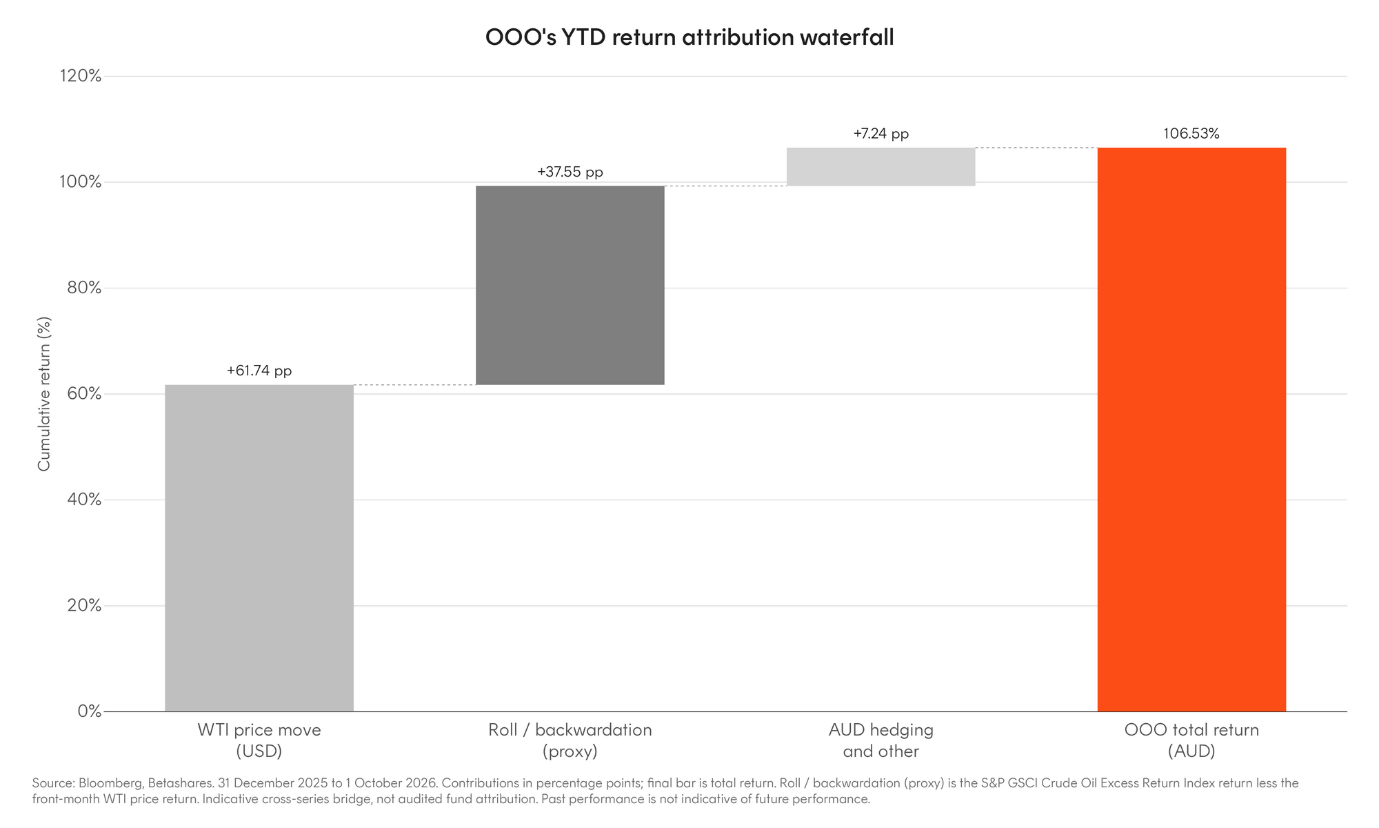
The rally in crude since late February has been the obvious driver, but less appreciated is the role that the shape of the oil futures curve has played, contributing to around a third of the gain on top of the price move.
Year-to-date (31 December 2025 to 1 October 2026), front-month WTI rose 61.74% in US dollars, while the S&P GSCI Crude Oil Excess Return Index, which measures the return from holding and rolling futures, rose 99.29%. That 37% gap is largely the contribution from a futures curve in ‘backwardation’, with the remaining 7% attributable to the return on cash collateral and AUD hedging carry.
In backwardation, near-dated futures trade above later-dated contracts, typically because tight physical supply puts a premium on barrels available now. An investor holding futures rolls from the expiring contract into a cheaper, later dated one.
The roll itself creates no gain, but the return accrues as that cheaper contract converges upwards towards the prevailing price as it approaches expiry. This is the reason why the rolling excess return index pulled so far ahead of the spot front-month WTI price from April onwards. As long as the curve stays backwardated, rolldown adds to returns even when the oil price is flat.
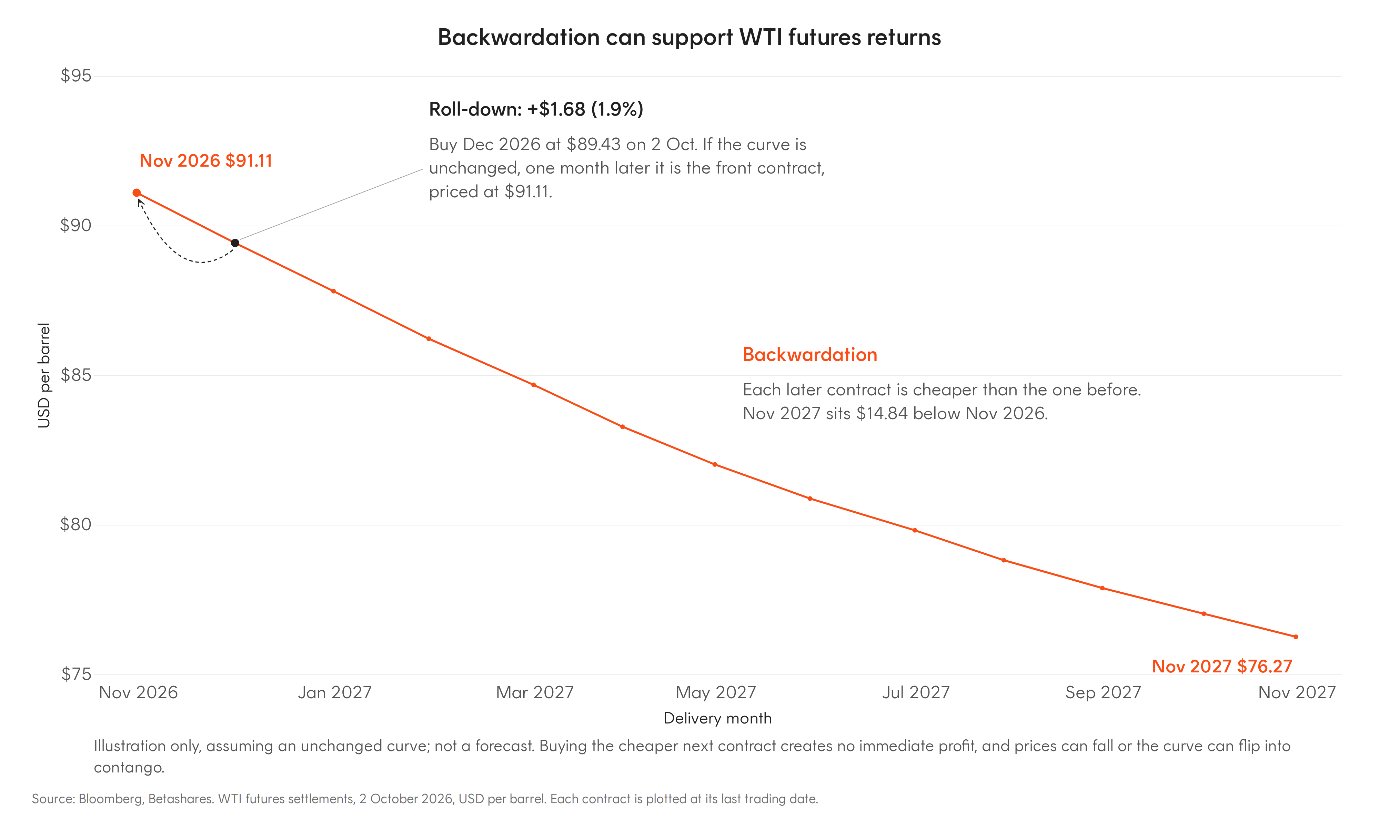
The shape of the curve is ultimately set by inventories. When stocks are tight, refiners and other users place a premium on having physical barrels on hand, known as the convenience yield. If that premium outweighs the cost of financing and storing oil, near-dated contracts trade above later ones and the curve is backward dated.
When inventories are abundant, the convenience yield shrinks and storage demand takes over. This situation can create “contango”, where near-term contracts trade below longer-term ones, and the same mechanism works in reverse, producing negative roll returns.
Barrels of diversification
One of the defining features of the post-pandemic macro environment has been the rolling supply shocks. This started from the supply chain bottlenecks around the reopening of the global economy, made worse by the Russian invasion of Ukraine in early 2022, and taking to another level following the war in Iran and the closure of the Strait of Hormuz.
What sets supply shocks apart for investors is their impact on bonds as a diversifier for growth assets. A supply shock raises inflation expectations and forces central banks to tighten, pushing bond yields higher just as stocks come under pressure.
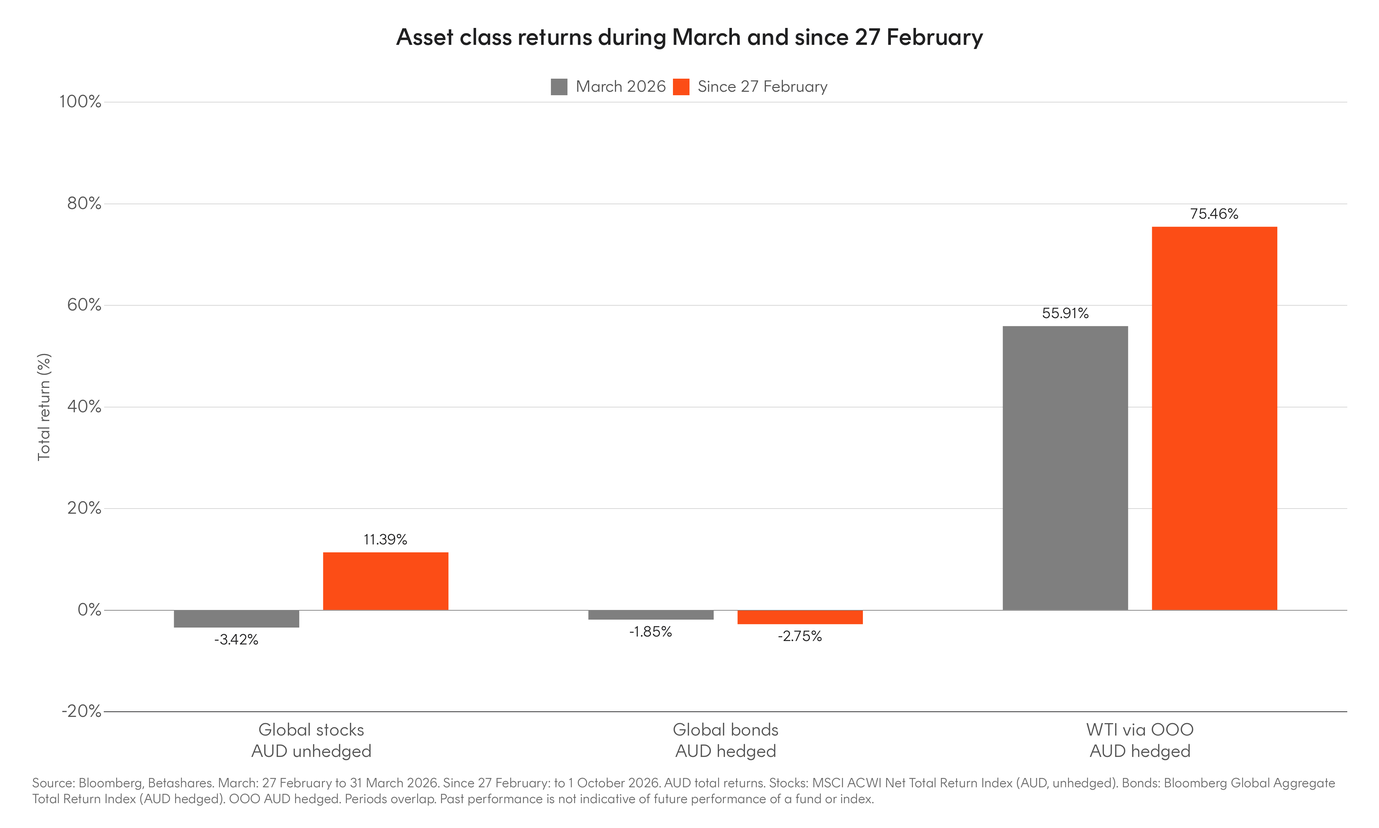
Commodities sit on the other side of that trade. The same supply disruption that drives inflation higher tends to lift commodity prices, so in supply shocks and broader inflationary regimes, commodity returns can become negatively correlated with both stocks and bonds.
That is the diversification gap traditional portfolios have struggled to fill, and crude, as the commodity most exposed to supply disruption, has been the clearest example this year.
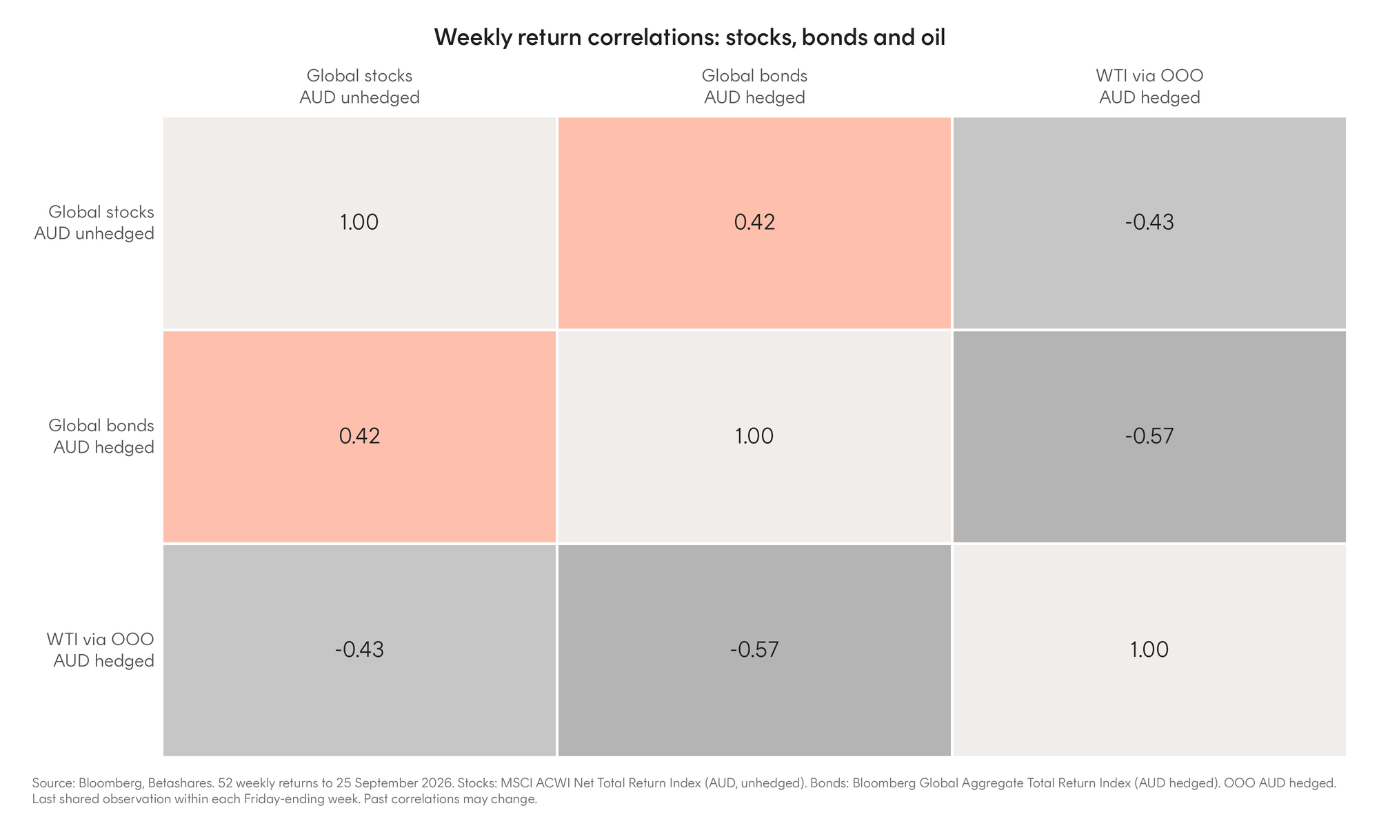
Despite this, many investors hold little or no commodity exposure, leaving them underweight an asset class that has historically shown low correlation to other major asset classes. As the only ‘pure’ crude oil futures exposure currently on the ASX, OOO Crude Oil Index Currency Hedged Complex ETF offers a direct way to fill that gap.