
David Bassanese
Betashares Chief Economist David is responsible for developing economic insights and portfolio construction strategies for adviser and retail clients. He was previously an economic columnist for The Australian Financial Review and spent several years as a senior economist and interest rate strategist at Bankers Trust and Macquarie Bank. David also held roles at the Commonwealth Treasury and Organisation for Economic Co-operation and Development (OECD) in Paris, France.
4 minutes reading time
Key global market trends – higher rates take their toll
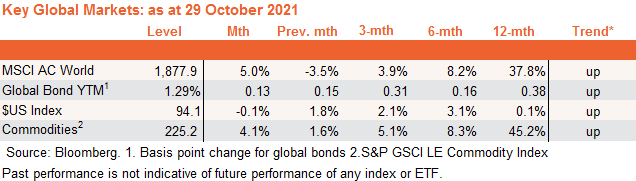
Global equities rebounded in October – despite a further lift in bond yields – as another strong U.S. corporate earnings reporting season and signs of peaking in the Delta outbreak supported sentiment.
The key market development was the strength in U.S. corporate earnings, despite widespread cost pressures and supply chain bottlenecks – suggesting corporate America has been well placed to support margins through price increases if need be. In turn, this helps explain why U.S. consumer price inflation has remained elevated in recent months.
Concerns with regard to Chinese property developer Evergrande have eased somewhat, with the embattled company meeting some interest payments on outstanding debt and generally continuing to (quietly) work through its problems.
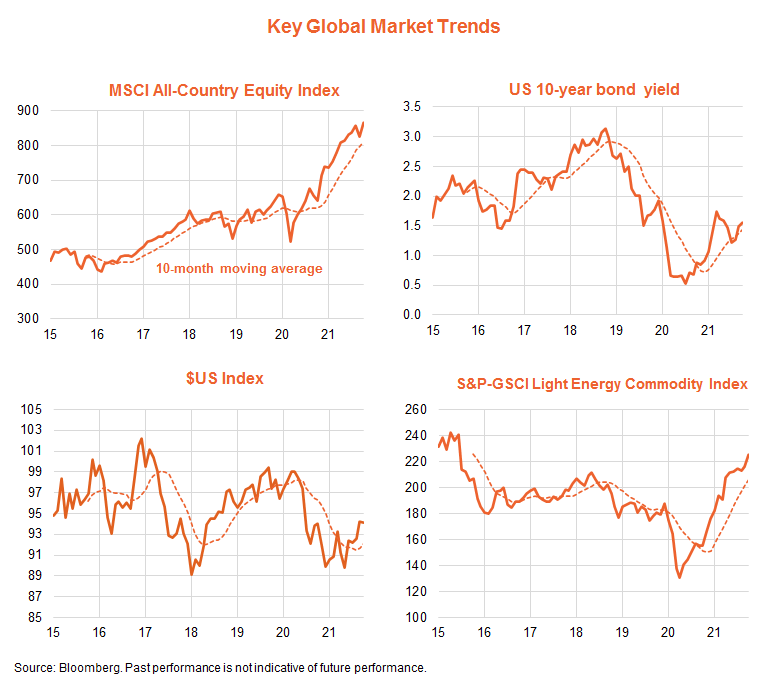
As evident in the chart set below, despite the recent pullback, the trend in stocks remains upward. The trend in bond yields, the U.S. dollar and overall commodities (driven by food and oil prices) are also positive.
Global equity fundamentals – valuation challenges as rates rise further
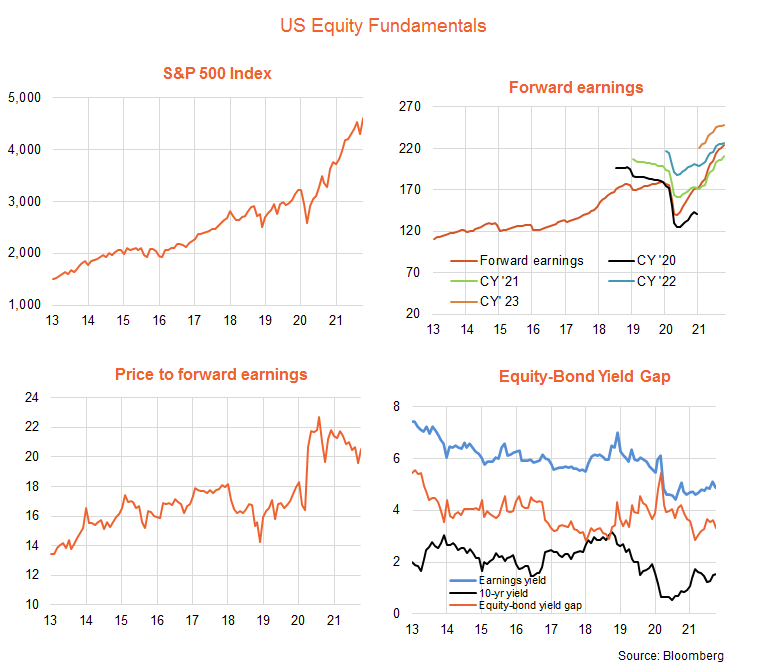
As evident in the chart set below, the U.S. equity market’s uptrend in recent months has been driven by growth in corporate earnings, though the PE ratio also lifted a little in October. Indeed, the S&P 500 rose 7%, reflecting a 2% lift in forward earnings and a 5% rise in the forward PE ratio from 19.6 to 20.5.
The nearer-term fundamental picture for equities remains mixed. On the positive side, earnings continue to be revised up and current expectations are consistent with forward earnings growth of 11% by end-2022. I anticipate further upward revisions such that forward earnings rise by 15% over this period.
At 20 times earnings, however, the U.S. PE ratio remains above its range of 14 to 18 in the pre-COVID years since 2013, which in turn reflects the fact that 10-year bond yields and the equity-to-bond yield gap (EBYG) are also somewhat below their average over this period.
Even though U.S. inflation should moderate next year, anticipation of Fed tightening in 2023 (as the labour market gradually tightens) could see U.S. 10-year bond yields hit 2% by end-2022. If the EBYG also returns to its longer-run average of 3.75% (from 3.3% at present), it would imply a fall in the PE ratio to 17.5 by end-2022, largely offsetting gains from growth in earnings.
All up, while the market need not crash anytime soon, an eventual normalisation of bond yields and equity valuations suggest at best only modest U.S. equity returns on a one-year view.
Global equity themes** – potential value opportunities
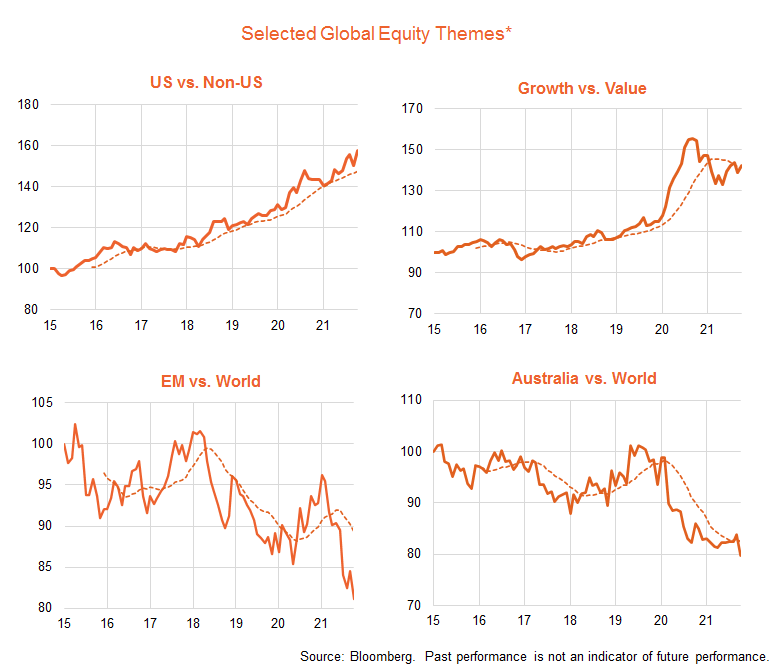
The chart set below outlines trends in several key ‘thematic tilts’ across global equity markets.
As evident, the U.S. market continues to generally outperform, while emerging markets remain in a firm relative performance downtrend. The battle between growth and value has been up and down so far this year, but has still generally favoured value – in line with rising oil prices and the choppy but upward path of bond yields.
The relative performance of the Australian market also remains negative, not helped by recent weakness in iron-ore prices and resource stocks and recent strength in technology stocks which enjoy a bigger weight in global markets.
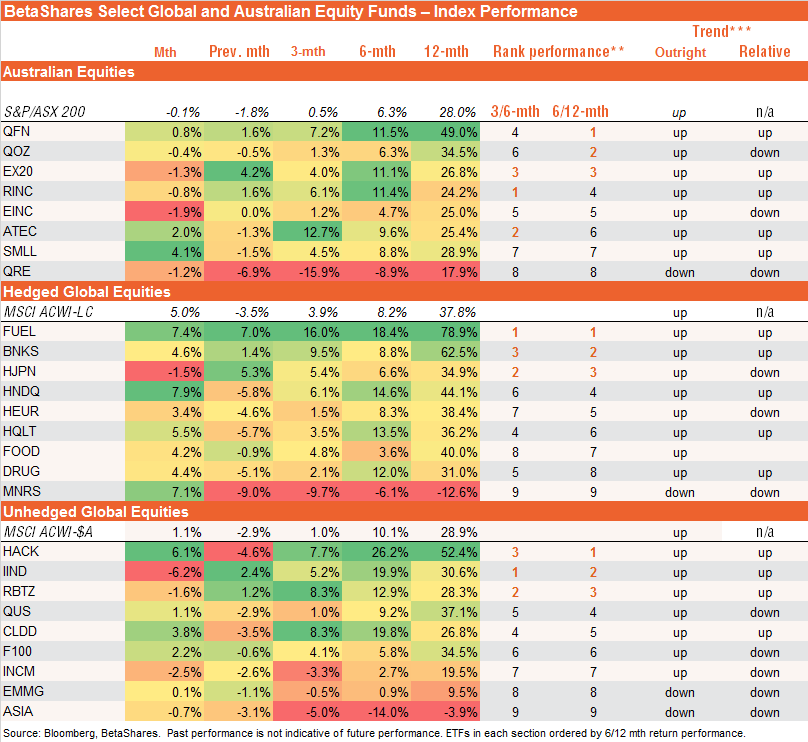
ETF performance snapshot
The table below sets out a selected list of BetaShares ETFs across various regional, sector and factor thematics. In Australia, the picture is mixed, though financials (QFN) and value-orientated exposures (like QOZ) remain the best relative performers on a six/twelve month basis.
Among currency-hedged global ETFs, it’s also the case that value exposures such as banks (BNKS), energy (FUEL), and Japanese equities (HJPN) are the best relative performers, though the growth-focused NASDAQ-100 (HNDQ) is a close fourth.
Among unhedged global ETFs, cybersecurity (HACK) , India (IIND) and robotics/AI (RBTZ) are the best relative performers.
Further information on the complete range of BetaShares exchange traded products can be found here.
*Equity theme proxies: US: S&P500; Non-US: MSCI Ex-US Developed Markets Index; Growth vs. Value: MSCI Global Growth and Value Indices; Emerging markets: MSCI Emerging Markets Index; Australia: S&P/ASX 200 Index.
** Ranking based on average of 3 and 6 month performance and 6 and 12 month performance, excluding latest monthly return performance.
***Trend: Outright trend is up if the relevant NAV return index is above its 10-month moving average and down if the index is below this moving average. Relative trend is up if the ratio of the relevant NAV monthly return index to the return index for the MSCI ACWI is above its 10-month moving average, and down otherwise.
David is responsible for developing economic insights and portfolio construction strategies for adviser and retail clients. He was previously an economic columnist for The Australian Financial Review and spent several years as a senior economist and interest rate strategist at Bankers Trust and Macquarie Bank. David also held roles at the Commonwealth Treasury and Organisation for Economic Co-operation and Development (OECD) in Paris, France.
Read more from David.