



Technical analysis of gold, US 10-year yields and the S&P 500, with fund implementation ideas.
Spot Gold
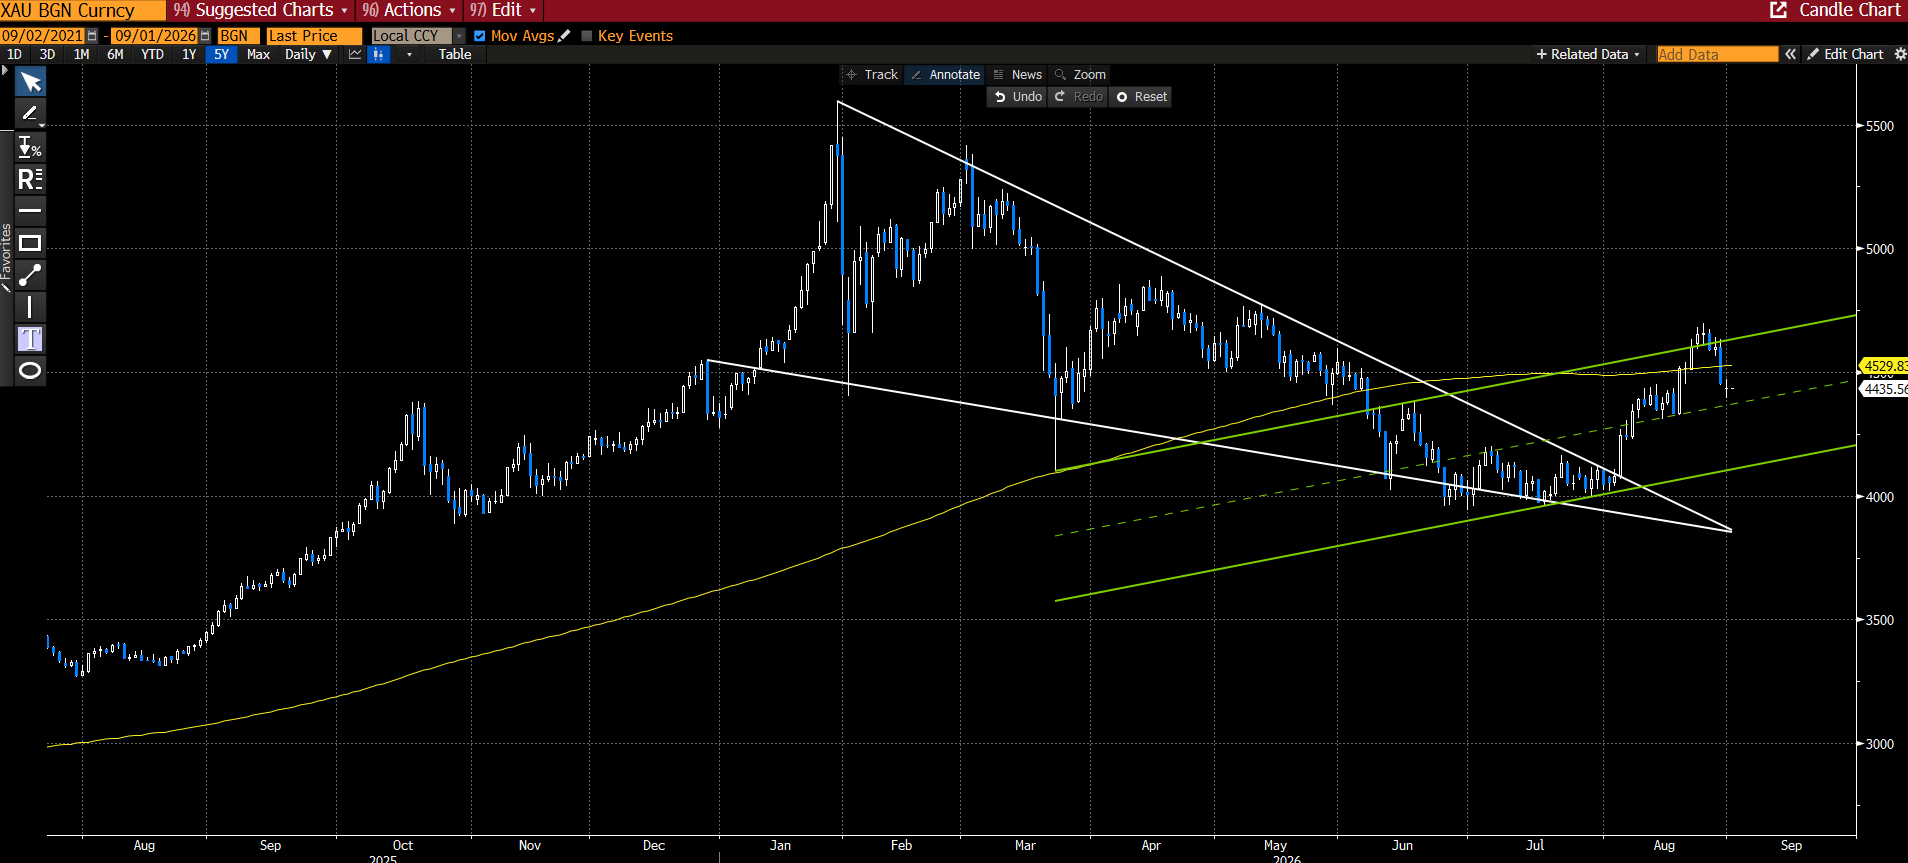
- Gold has finally broken out of the wedge pattern (white) highlighted over the last couple of months.
- On the break, gold immediately surged higher into the 200-day moving average (yellow) but has since closed back below that level.
- Gold’s price trend has shifted from bearish towards neutral, although it has yet to establish a clear pivot low following the move higher.
- Should gold retrace back towards the lower green line and hold support, this may offer an attractive long entry in line with the direction of the wedge breakout.
Daily chart
Source: Bloomberg. Past performance is not an indicator of future performance. You cannot invest directly in an index.
Fund implementation ideas
The US Government 10-year yield
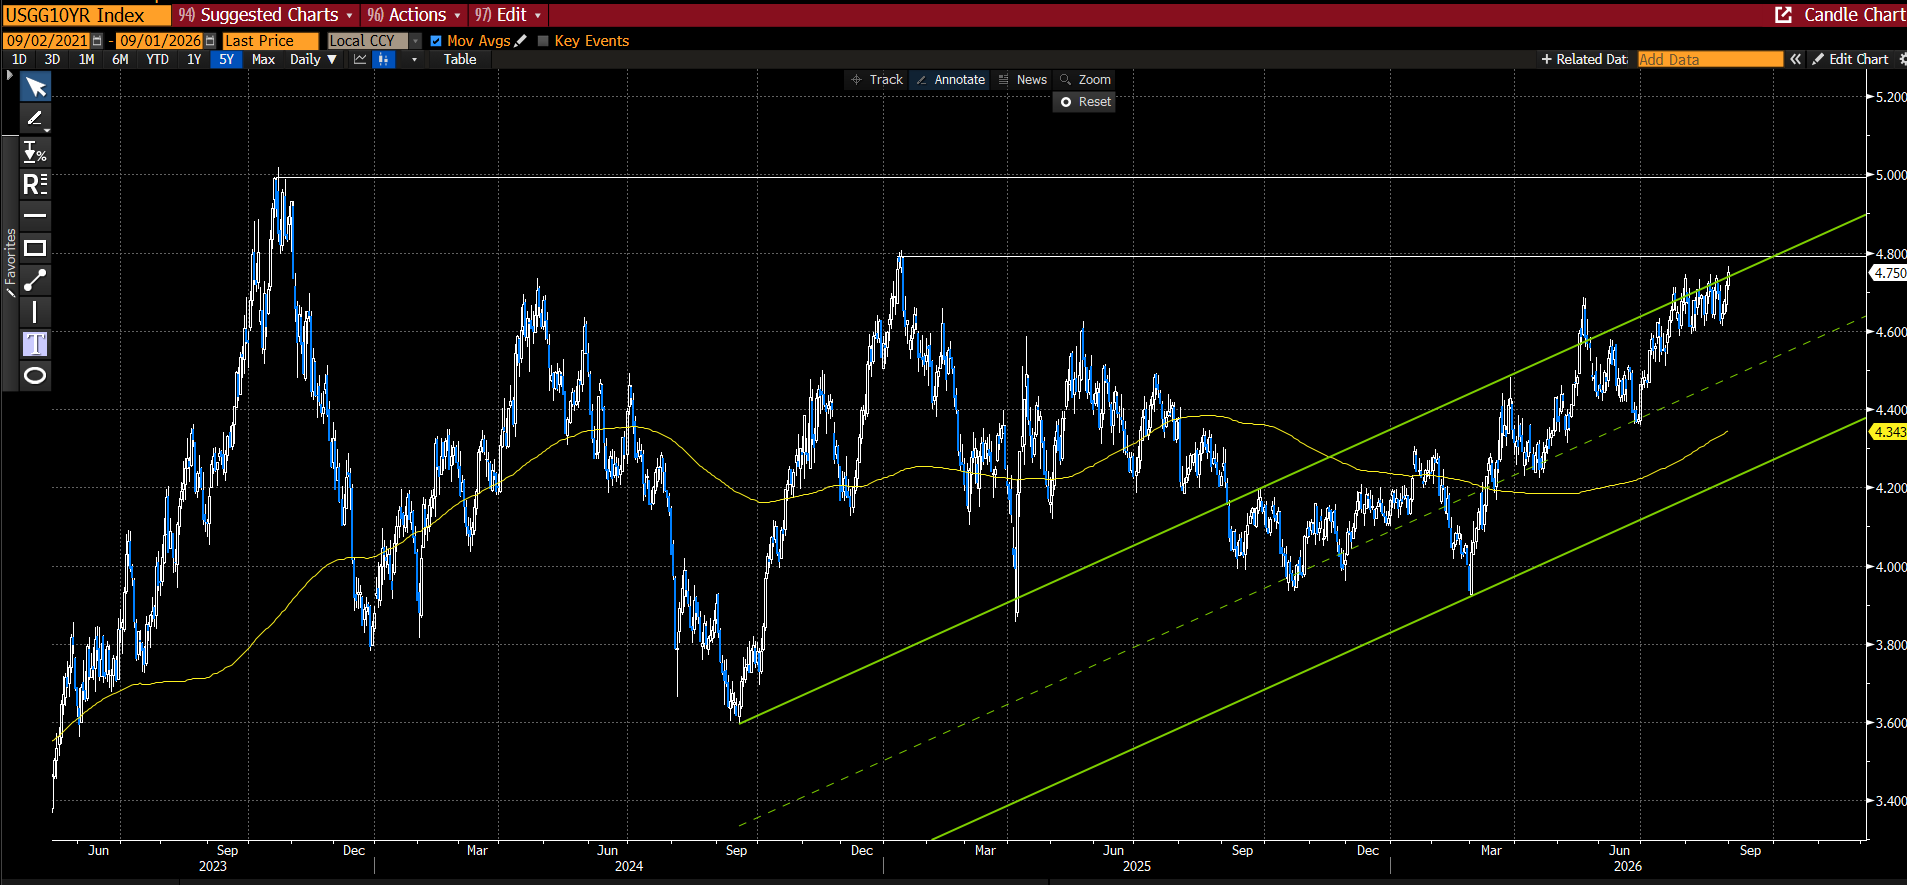
- The US Government 10-year yield is testing the top end of the channel (green), which coincides with a prior pivot high acting as resistance around 4.75-4.80%.
- Should yields break above that level, 5.0% becomes the next major resistance area.
Daily chart
Source: Bloomberg. Past performance is not an indicator of future performance.
Fund implementation ideas
| Bullish (yields higher) |
|---|
| BBFD – Geared Short US Treasury Bond Currency Hedged Complex ETF |
| Bearish (yields lower) |
|---|
| US10 – U.S. Treasury Bond 7-10 Year Currency Hedged ETF |
The S&P 500 Index
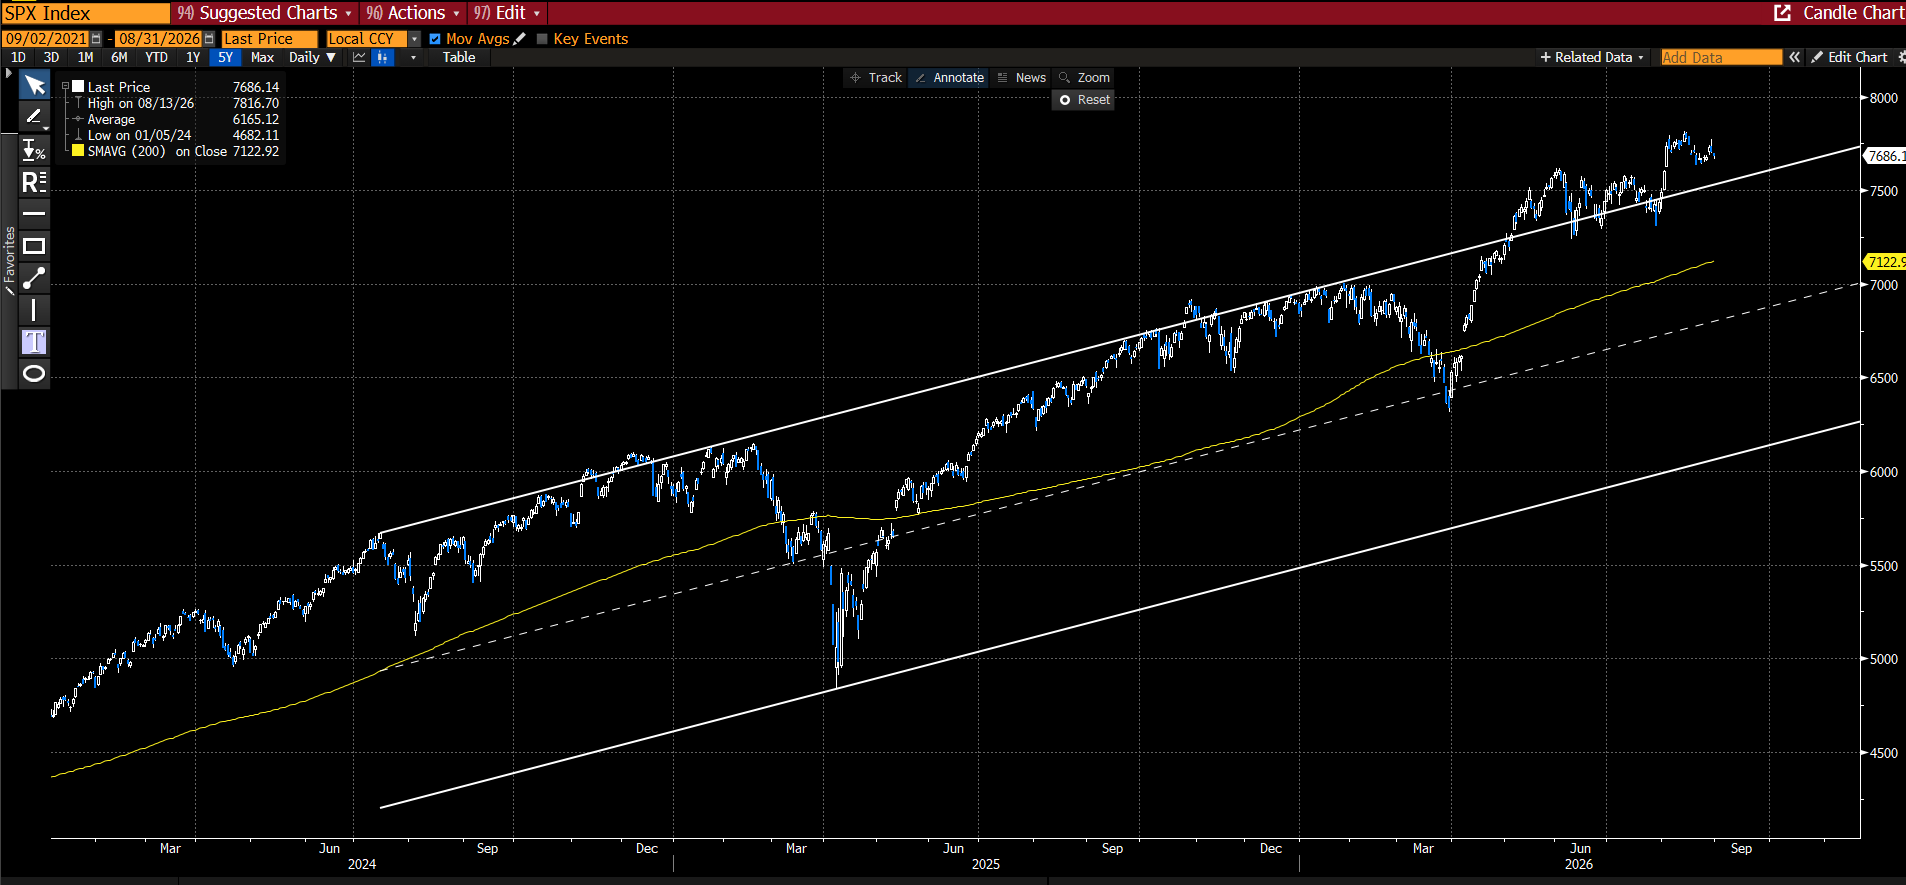
- The S&P 500 Index is trading above its longer-term trend channel, with the upper end of the channel (white) now acting as support.
- The short-term trend remains bullish while prices hold above the upper trend line.
- Should prices break back inside the channel, prices generally move back down towards the middle of that channel, which may offer a more attractive long entry point with the upward trend.
Daily chart
Source: Bloomberg. Past performance is not an indicator of future performance. You cannot invest directly in an index.
Fund implementation ideas
ABOUT BETASHARES TECHNICAL WATCH SERIES
In this regular monthly Technical Watch series, I provide a snapshot of what I am currently seeing within the charts.
I am aiming to make this series as helpful as possible, so I strongly encourage readers to request a particular analysis from me. To this end, I will try to include at least one ‘reader’s choice’ chart or a chart of particular interest.
When it comes to technical analysis and charting, one should always try to put emotion and personal opinions about the markets aside in order to focus on what the charts are showing. Of course, these notes provide general information only and readers should form their own views about the outlook for markets.